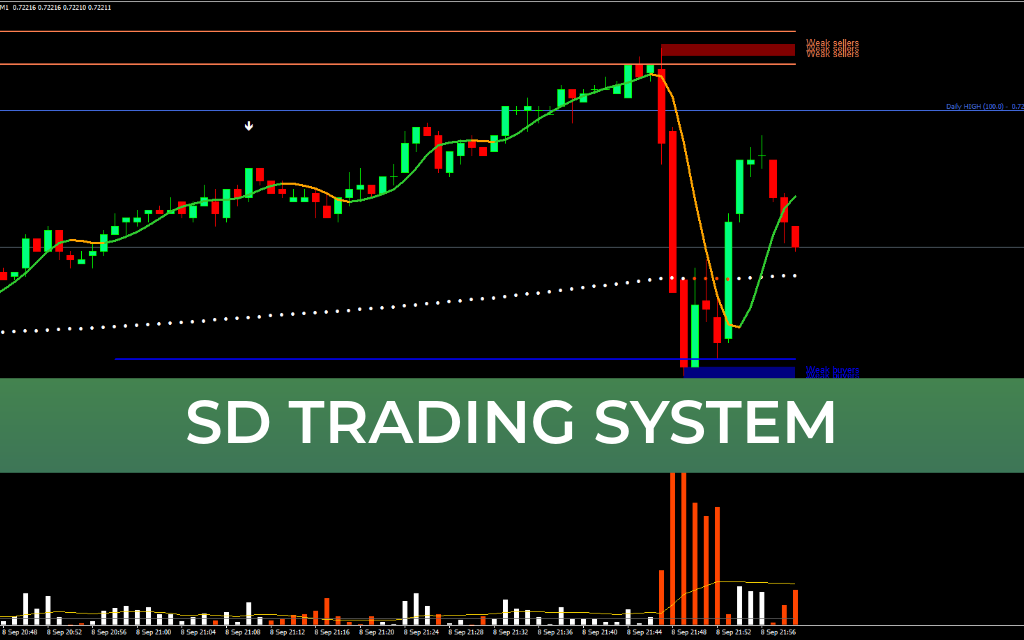
SD Trading System MT4 is a multi-indicator trading template for MetaTrader 4 designed around supply and demand analysis, trend continuation, Support And Resistance, and reaction zones. The system combines several technical tools into one trading workspace, allowing traders to identify important market areas and look for potential entries when price reacts around those levels.
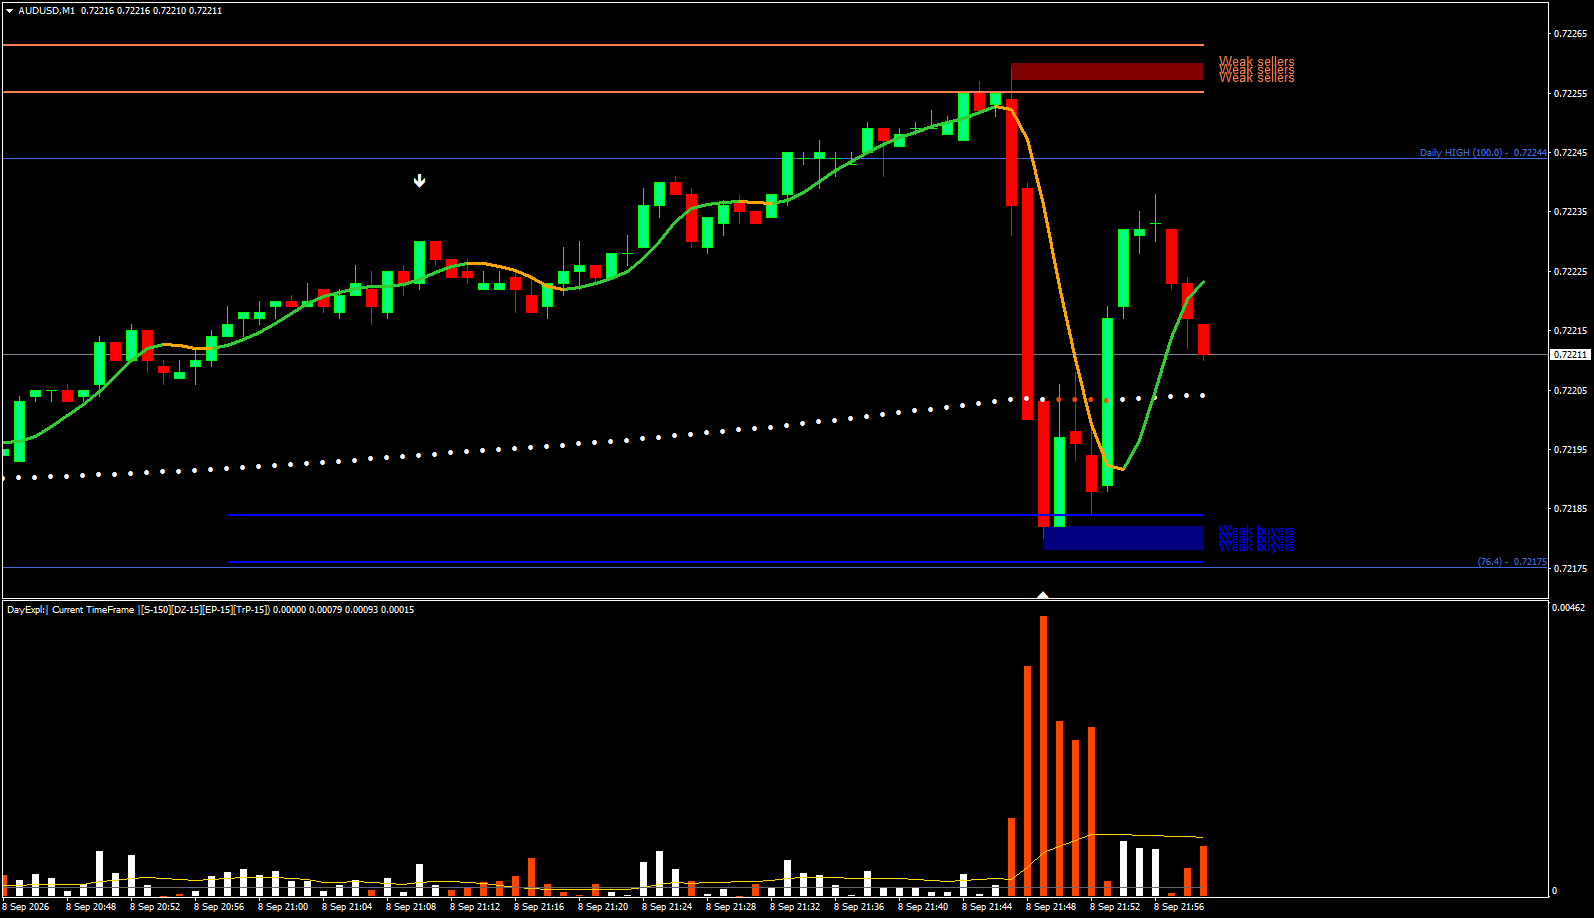
The main concept behind the SD Trading System MT4 is to trade from significant market zones instead of entering randomly in the middle of a price movement. The template combines dynamic support and resistance areas, pivot levels, trend filtering, and directional signals to provide multiple layers of confirmation.
Each indicator has a specific role within the setup. Some components identify important price zones, while others help determine trend direction and potential entry timing. This creates a structured approach that can be useful for traders who prefer analyzing price reactions around established support, resistance, and supply-demand levels.
How SD Trading System MT4 Works
The SD Trading System MT4 is based on the idea that important market zones can influence future price behavior. When price reaches an established supply, demand, support, resistance, or pivot area, traders can watch for signs of rejection, continuation, or reversal.
A basic trading workflow can include:
Identify important Supply And Demand zones.
Check nearby pivot and support/resistance levels.
Determine the current trend using the SD Trading Support indicator.
Wait for an SD Trading Signal confirmation.
Look for price reaction around the identified market zone.
Apply suitable risk management before entering the trade.
The different indicators work together rather than requiring traders to rely on a single signal.
Indicators Included in SD Trading System MT4
SD Trading Pivot Points Indicator
SD Trading Pivot Points displays daily Fibonacci-style pivot levels directly on the chart. These levels can provide useful reference points for intraday traders because they highlight potential areas of support and resistance.
Pivot levels can be used to identify possible reaction zones, pullback areas, reversal points, and potential profit targets. Traders can also compare pivot levels with supply and demand zones to find areas where several technical factors overlap.
When multiple levels appear close together, the area may deserve additional attention because price could react more strongly around that region.
The indicator can be particularly useful during active market sessions when increased volatility creates larger intraday movements.
SD Trading S&R Indicator
SD Trading S&R identifies supply and demand areas together with potential buyer and seller strength. The indicator is designed to highlight areas where price may have previously reversed, consolidated, or experienced significant buying or selling activity.
Supply zones are generally displayed above the current market price, while demand zones can appear below price. These areas provide traders with a visual framework for evaluating where buying or selling pressure may become important.
Instead of entering immediately after a signal appears, traders can use these zones to determine whether the signal is occurring at a meaningful location on the chart.
For example, a bearish signal near a strong supply zone may provide more context than the same signal appearing in the middle of a trend without any nearby resistance.
SD Trading Signal Indicator
SD Trading Signal Indicator generates directional arrows near potential turning points and continuation setups. The signals provide visual entry timing and can help traders identify moments when price may be preparing for another move.
However, the signals are designed to work alongside the system's Market Structure rather than being traded independently.
A buy signal occurring near a demand zone while the overall trend is bullish can provide a more complete setup. Similarly, a sell signal appearing near supply and resistance during a bearish trend can offer additional confirmation.
This makes the signal indicator more useful when combined with the other components of the SD Trading System MT4.
SD Trading Support Indicator
SD Trading Support is the primary trend-following component of the template. It displays dynamic moving-average-style lines directly on the chart and uses color changes to help identify bullish and bearish market phases.
The indicator can act as a visual trend filter. When the market is clearly moving in one direction, traders can use the trend indication to avoid taking positions against the prevailing movement.
For example, during a bullish phase, traders may focus more heavily on demand-zone reactions and bullish continuation signals. During a bearish phase, attention can shift toward supply zones and bearish setups.
This trend-filtering approach can help reduce trades taken against strong directional momentum.
Supply and Demand Trading Approach
Supply and demand analysis is at the center of the SD Trading System MT4. Instead of viewing every price movement as a potential trade, the system encourages traders to wait for price to reach areas that have greater technical significance.
A demand zone can represent an area where buying interest previously became strong enough to push price higher. A supply zone can represent an area where selling pressure previously caused price to move lower.
When price returns to these areas, traders can observe whether the market reacts again.
The strongest setups may occur when several factors align, such as:
Price reaches a major demand or supply zone.
The trend agrees with the potential trade direction.
A nearby pivot level provides additional confirmation.
The SD Trading Signal indicator produces a directional signal.
Price Action confirms the reaction from the zone.
SD Trading System MT4 for Trend Continuation
Although supply and demand strategies are often associated with reversals, the SD Trading System MT4 can also be used for trend continuation setups.
During a strong bullish trend, price may temporarily pull back toward a demand or support area before continuing higher. Traders can wait for a bullish signal around that zone instead of buying after an extended upward move.
The same concept can apply during bearish trends. A temporary rally toward supply or resistance can provide a potential location to look for bearish continuation signals.
This approach can help traders avoid chasing price and instead wait for more structured pullback opportunities.
Using Support and Resistance with Pivot Levels
Combining support and resistance with pivot levels can provide additional chart context. A supply or demand zone that overlaps with an important pivot level may deserve greater attention than an isolated level.
For intraday traders, these areas can be useful when planning potential entry zones, stop-loss locations, and profit targets.
However, technical levels should not be treated as guaranteed reversal points. Markets can break through previously respected zones, especially during strong trends or periods of high volatility.
Best Market Conditions for SD Trading System MT4
The SD Trading System MT4 can be most useful when price is moving with enough activity to produce clear reactions around important zones.
Active trading sessions can create stronger price movements and provide more opportunities for price to interact with support, resistance, supply, demand, and pivot levels.
Sideways conditions can be more difficult because price may repeatedly cross levels without establishing a clear direction. In such environments, traders may benefit from waiting for stronger confirmation instead of reacting to every signal.
Advantages of SD Trading System MT4
The system provides several useful features for technical traders:
Combines supply and demand analysis with trend filtering.
Displays dynamic support and resistance areas.
Includes daily pivot levels.
Provides visual buy and sell signals.
Helps identify potential reaction zones.
Supports trend continuation strategies.
Uses multiple indicators for confirmation.
Provides a structured approach to market analysis.
The main advantage is the combination of market zones, trend direction, and entry signals within one MT4 template.
Risk Management Considerations
No technical indicator or trading template can guarantee profitable results. Supply and demand zones can fail, pivot levels can be broken, and signals can produce false entries during changing market conditions.
Traders should therefore use appropriate position sizing and define their risk before entering a trade. Stop-loss placement should take the relevant market structure and volatility into consideration rather than being selected randomly.
It is also useful to test the SD Trading System MT4 on a demo account before applying it to live trading. This allows traders to understand how the indicators behave across different market conditions and timeframes.
Final Thoughts
SD Trading System MT4 is a multi-indicator trading template that combines supply and demand zones, pivot points, support and resistance, trend filtering, and directional signals into one structured trading environment.
The SD Trading Pivot Points indicator provides important intraday reference levels, SD Trading S&R highlights supply and demand areas, SD Trading Signal provides potential entry timing, and SD Trading Support helps traders identify the prevailing trend.
The strongest approach is to use these tools together rather than treating individual signals as automatic trade instructions. Waiting for price to reach an important zone and then confirming the trend and entry signal can create a more disciplined trading process.
If you want to explore more Forex indicators, MT4 trading systems, and technical-analysis templates, visit IndicatorForest.com for additional trading resources.
Image Suggestions
Image 1: sd-trading-system-mt4-supply-demand.png
ALT: SD Trading System MT4 supply and demand zones on a Forex chart
Image 2: sd-trading-system-mt4-pivot-points.png
ALT: SD Trading System MT4 pivot points and support resistance levels
Image 3: sd-trading-system-mt4-signals.png
ALT: SD Trading System MT4 entry signals and Trend Confirmation
Internal Link Suggestion
Link to the relevant MT4 Trading Systems, Supply and Demand Indicators, or Forex Indicators category on IndicatorForest.com.
Published:
Sep 08, 2026 15:02 PM
Category: