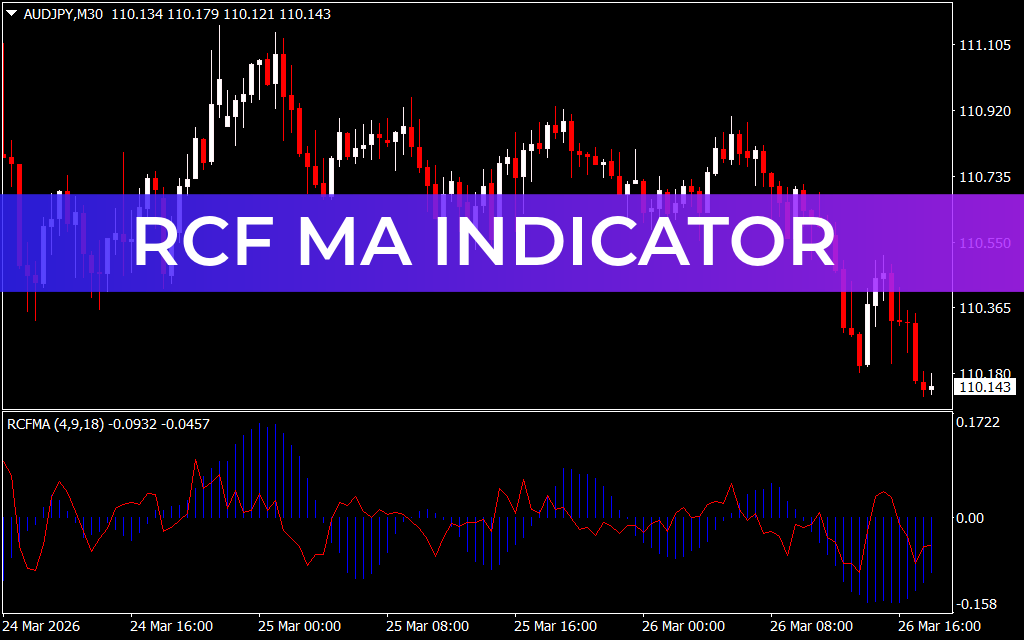
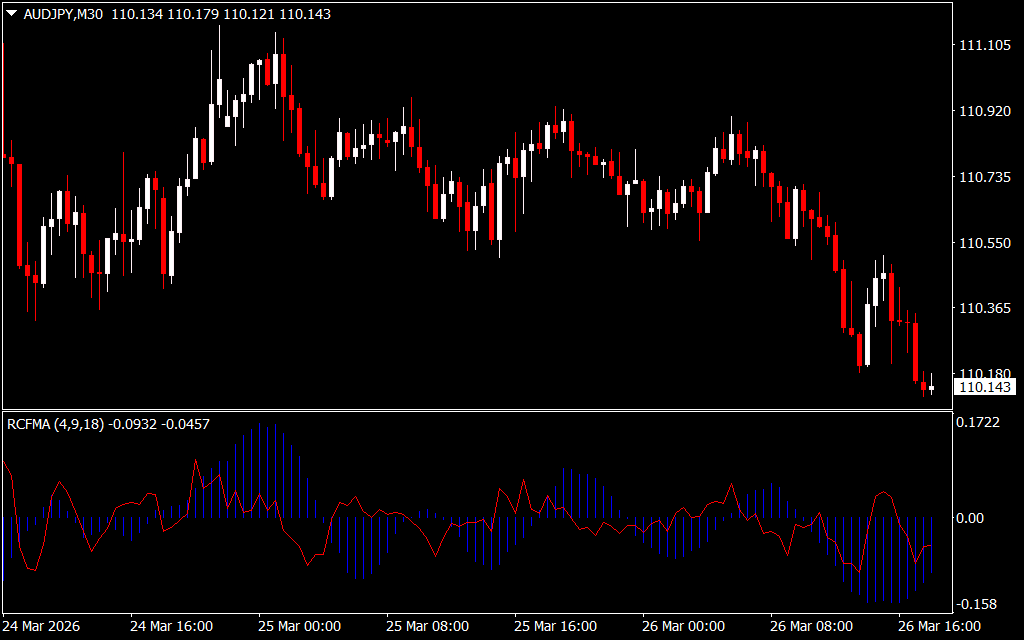
The RCF MA Indicator for MT4 is a powerful tool that removes the lag commonly associated with regular moving averages and presents the results as a histogram. While it resembles the classic MACD indicator in visual style, the underlying calculations are different, allowing traders to gain a fresh perspective on market trends.
This indicator works effectively across all intraday chart timeframes and higher, making it suitable for both new and advanced forex traders. It can also be integrated into automated trading strategies. For best results, traders should use the RCF MA in conjunction with other trend-based technical indicators.
Features and Trading Signals
- Histogram Bars: Blue bars plotted above or below the ZERO line indicate bullish or bearish market conditions.
- Red Signal Line: Complements the histogram for better trend analysis.
- Customizable Settings: Adjust the Fast MA, Middle MA, and Slow MA periods for short-term or long-term trading strategies.
How to Trade with RCF MA
- Bullish Market:
- Enter buy trades when histogram bars rise above the ZERO line.
- Place a stop loss below the previous swing low.
- Book profits using a favorable risk-reward ratio or at an opposite signal.
- Bearish Market:
- Enter sell trades when histogram bars drop below the ZERO line.
- Secure positions with a stop loss above the previous swing high.
Note: The RCF MA does not provide explicit profit targets, so traders should manage exits based on Price Action or complementary indicators.
Conclusion
In summary, the RCF MA Indicator for MT4 provides traders with a lag-free perspective on moving averages, helping identify bullish and bearish conditions more clearly. While it can be used as a standalone tool, combining it with other trend-following indicators enhances accuracy and trading performance.
FAQ
Published:
Mar 26, 2026 13:19 PM
Category: