he MTF Fractals indicator is a powerful trading tool used to identify trend reversals, retracements, and potential breakout points in the market. It is based on the fractal concept introduced by Bill Williams and widely used in modern technical analysis.
Traders rely on fractals because they help pinpoint key turning points in Price Action, allowing entries at more favorable levels. One of the major advantages of the MTF Fractals indicator is that it does not repaint, making its signals reliable for real trading conditions.
The indicator is available in both the standard fractal version and modified multi-timeframe (MTF) versions, which provide additional insights by displaying fractals from multiple timeframes on a single chart.
How the MTF Fractals Indicator Works
The MTF (Multi-Timeframe) Fractals indicator displays fractal levels from several timeframes directly on the current chart. This allows traders to analyze higher-timeframe Support And Resistance levels without switching charts.
By default:
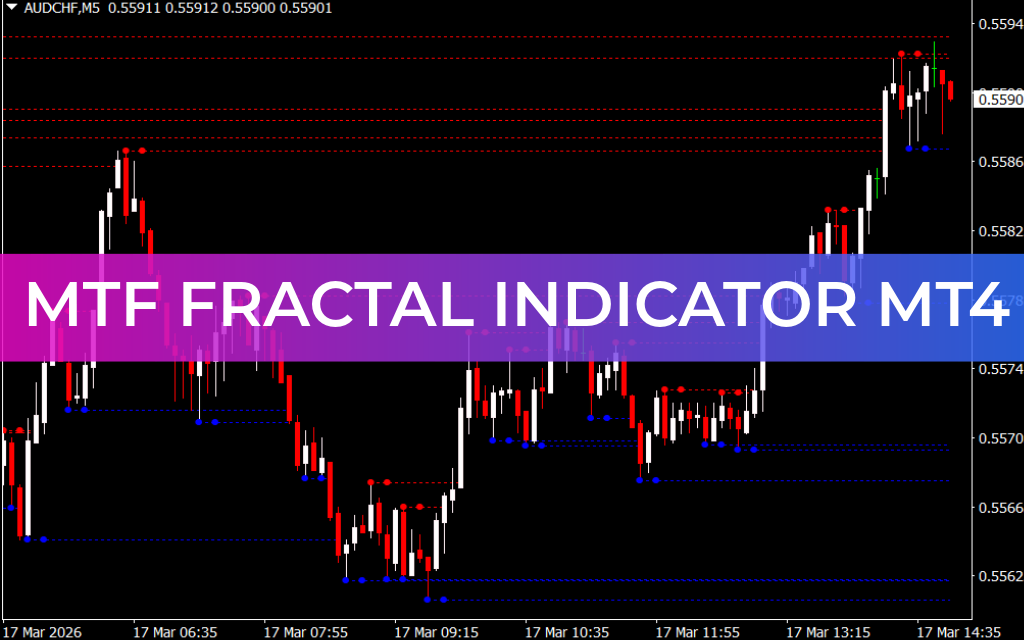
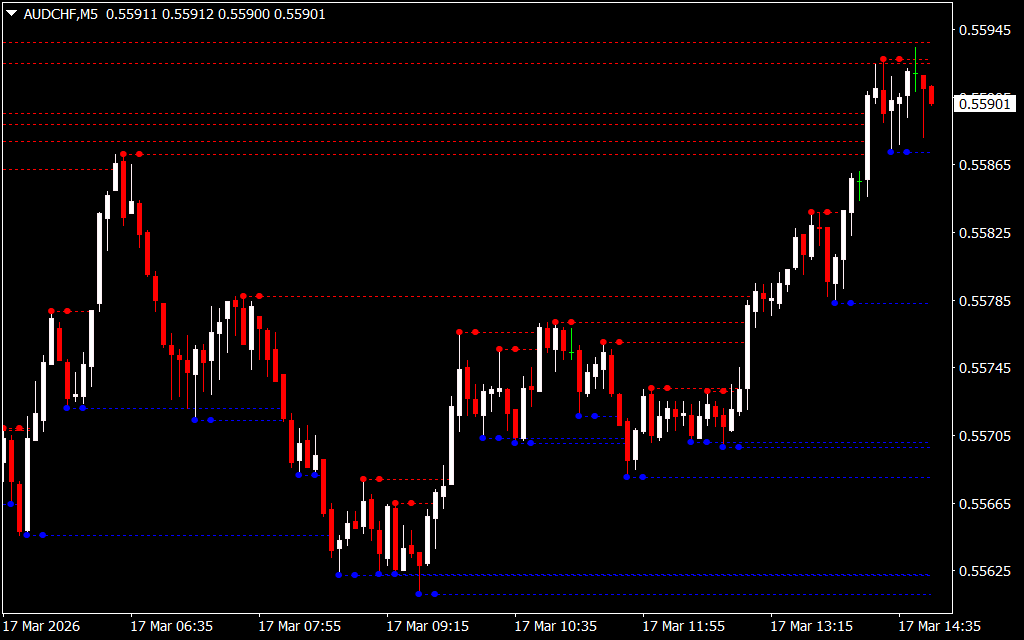
- Up fractals are highlighted in red
- Down fractals are highlighted in blue
When you move the cursor over a fractal line, the indicator shows:
- The timeframe where the fractal formed
- The exact price level of that fractal
This feature helps traders quickly identify important market levels and understand how price behaves across multiple timeframes.
Because of this functionality, the MTF Fractals indicator is especially useful for traders who use fractal theory as part of their trading strategies. It simplifies analysis by displaying all necessary information on a single screen, eliminating the need to open multiple charts.
In addition, the indicator can be used as:
- A standalone analysis tool
- A component of a custom trading system
- A Confirmation Indicator alongside other technical tools
MTF Fractals Trading Strategy
Below are two common trading setups using the MTF Fractals indicator.
Buy Setup (Bullish Strategy)
Follow these steps when looking for a buy opportunity:
- Identify an up fractal (blue line) on the chart.
- Wait for a bullish candle to close above the fractal support level.
- Place a Buy Stop order a few pips above the high of that candle.
- Set the Stop Loss slightly below the fractal support.
- Take profit using one of the following methods:
- Close the trade manually when down fractals appear.
- Place the Take Profit at the next horizontal resistance level.
This strategy allows traders to enter a potential upward move after confirmation of bullish momentum.
Sell Setup (Bearish Strategy)
For a sell trade, follow these steps:
- Identify a down fractal (red line) on the chart.
- Wait for a bearish candle to close below the fractal resistance.
- Place a Sell Stop order slightly below the candle’s low.
- Set the Stop Loss slightly above the fractal resistance.
- Take profit using one of these methods:
- Exit the trade when up fractals appear.
- Place the Take Profit at the next horizontal support level.
This setup helps traders capture downward momentum after a confirmed breakdown.
Conclusion
The MTF Fractals indicator, derived from the fractal concept introduced by Bill Williams, is a valuable tool for identifying trend reversals and retracement levels. By displaying fractals from multiple timeframes on a single chart, it simplifies market analysis and highlights key support and resistance zones.
Although the indicator works on any timeframe, traders should avoid relying on it alone. For better accuracy and risk management, it is recommended to combine it with other technical indicators, price action analysis, or Market Structure tools.
FAQ
1 Download
Published:
Mar 17, 2026 09:58 AM
Category: