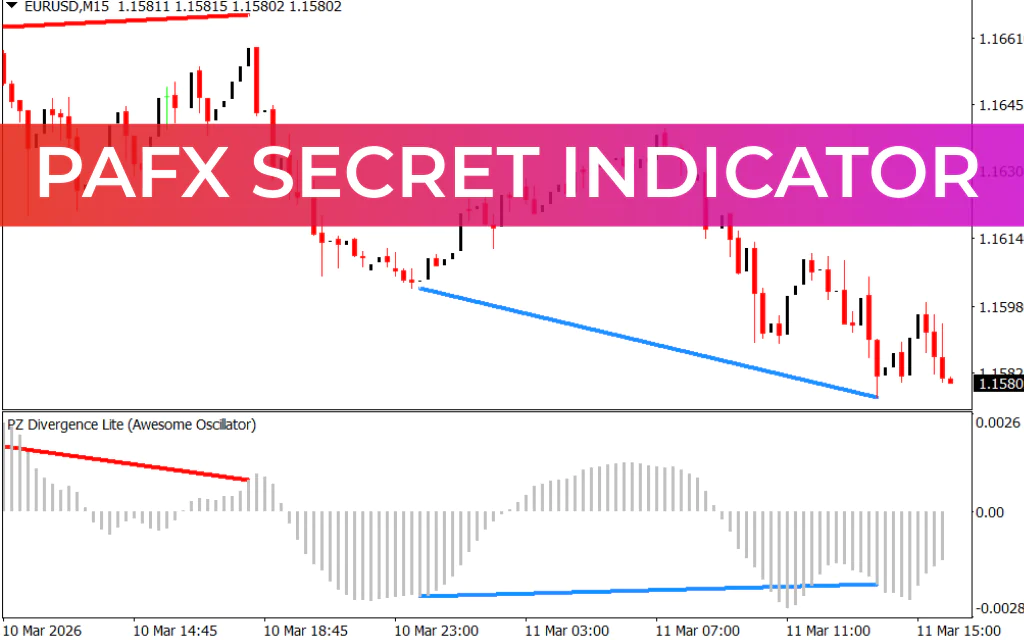
The PAFX Secret Indicator is a simple yet powerful MT4 tool for tracking market momentum and generating buy/sell signals. It plots a MACD-style histogram in a separate window, showing upward and downward bars to indicate the market’s current momentum and potential trend reversals.
This indicator helps traders visually assess market strength and identify high-probability entry and exit points for both Forex and stock trading.

How the PAFX Secret Indicator Works
The histogram bars represent trading momentum:
- Down Bars:
- Indicate the market is in a downtrend momentum
- Suggest a potential uptrend reversal is approaching
- Up Bars:
- Indicate the market is in an uptrend momentum
- Suggest a potential downtrend reversal is approaching
Buy Signal
- Indicator is below the zero line
- Histogram bars are below zero, signaling the market is ready for a bullish move
- Enter a long position when confirmed with Price Action or additional momentum indicators (like RSI)
Sell Signal
- Indicator is above the zero line
- Histogram bars are above zero, signaling the market is ready for a bearish move
- Enter a short position when confirmed with price action or additional indicators
Rule of Thumb:
- High price with high histogram → Consider selling
- Low price with low histogram → Consider buying
Best Practices
- Works on any timeframe, but recommended for longer timeframes for more reliable signals
- Combine with other indicators such as RSI or support/resistance levels for better accuracy
- Ideal for trend-following traders who want a clear visual of momentum and signals
Conclusion
The PAFX Secret Indicator for MT4 is a must-have tool for traders looking to monitor market momentum and visualize buy/sell opportunities. With its histogram-based display, traders can quickly identify Trend Strength and reversal points.
You can download the PAFX Secret Indicator for free and integrate it into your MT4 setup for smarter trading decisions.
FAQ
2 Downloads
Published:
Mar 11, 2026 11:01 AM
Category: