The Moving Average of Oscillator Indicator, commonly known as the OsMA Indicator, is a powerful tool that helps traders identify overbought and oversold conditions in the market. By measuring the difference between the MACD and its signal line, the indicator provides valuable insights into momentum shifts and potential trend reversals.
This makes it especially useful for traders looking to capture reversal opportunities in the Forex market.
What is the OsMA Indicator?
The OsMA (Moving Average of Oscillator) is calculated using the formula:
OsMA = MACD – Signal Line
- MACD: Difference between a 12-period EMA and a 26-period EMA
- Signal Line: 9-period moving average of the MACD
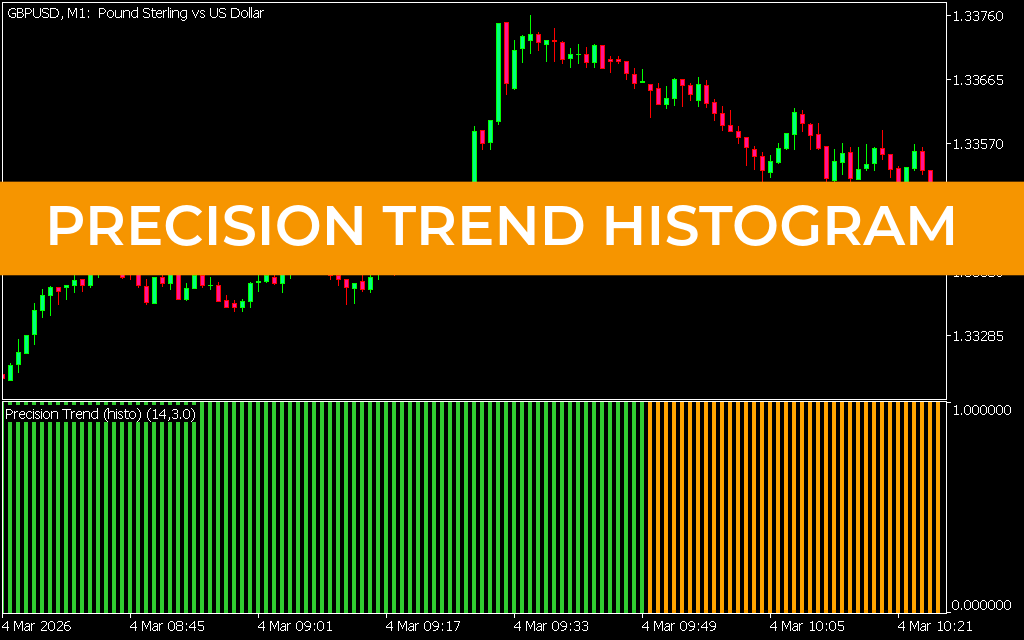
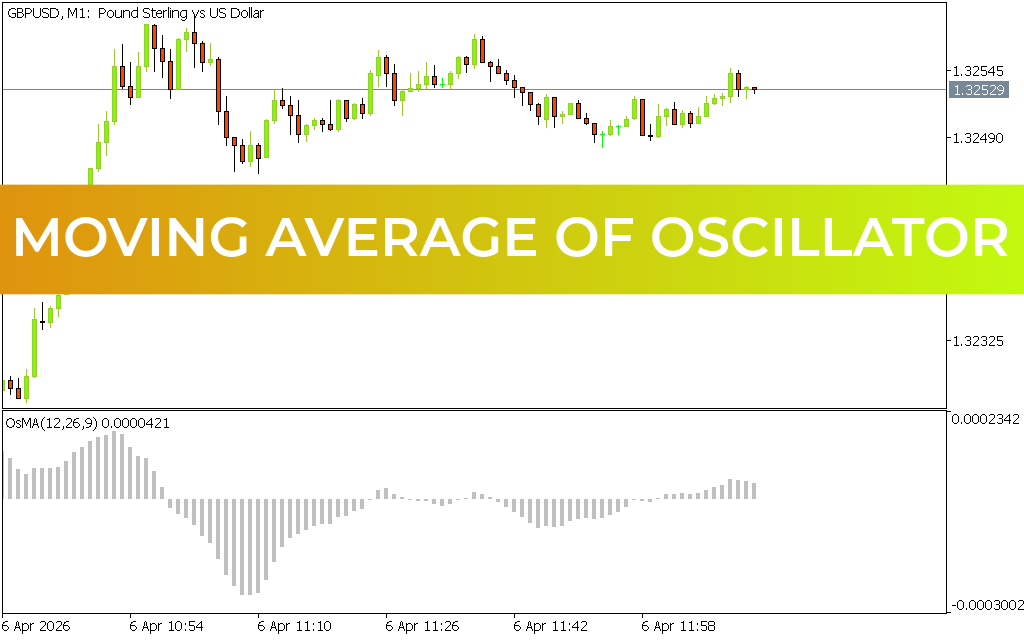
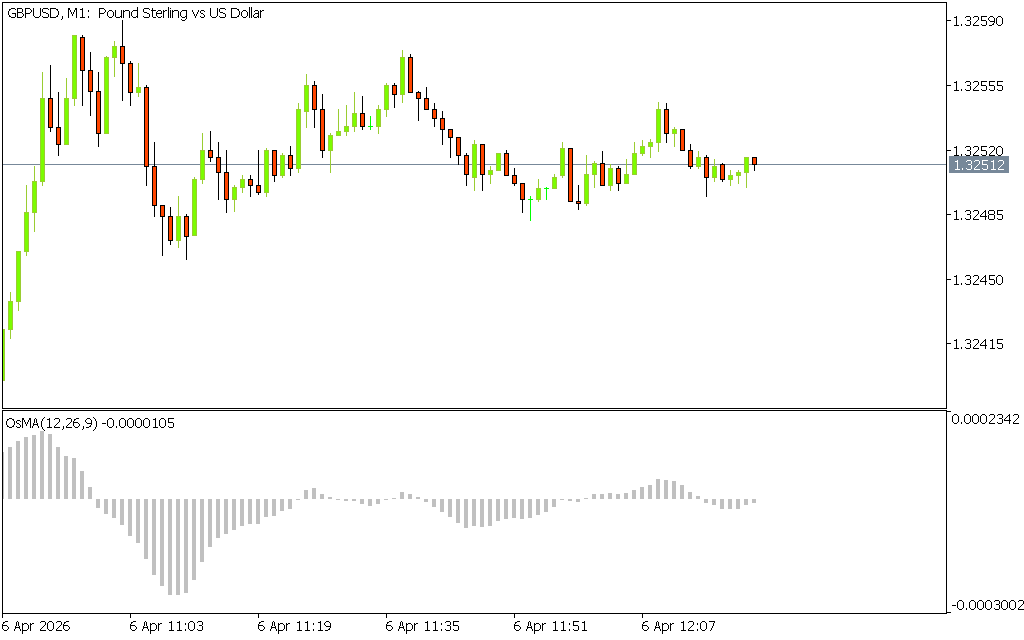
The result is displayed as a histogram, which shows the distance between the MACD line and its signal line.
Key Features of OsMA Indicator for MT5
- Displays a histogram for easy visualization of momentum
- Identifies overbought and oversold market conditions
- Highlights bullish and bearish divergences
- Helps detect potential trend reversals
- Suitable for all timeframes
- Beginner-friendly and widely used
How the Indicator Works
The OsMA indicator appears as a histogram below the price chart:
- Positive Histogram: Bullish momentum
- Negative Histogram: Bearish momentum
- Shrinking Bars: Weakening trend
- Growing Bars: Strengthening trend
One of the most important signals provided by the indicator is divergence between price and momentum.
Trading Strategy Using OsMA Indicator
1. Divergence Strategy
Divergence is one of the most effective ways to use the OsMA indicator:
- Bearish Divergence:
Price makes higher highs while the histogram makes lower highs → potential downtrend - Bullish Divergence:
Price makes lower lows while the histogram makes higher lows → potential uptrend
Entry Rule:
- Wait for divergence to form clearly
- Enter trade as histogram bars shrink toward the zero line
Exit Rule:
- Exit when histogram momentum weakens
- Or when bars reverse direction
2. Overbought & Oversold Conditions
- Extreme positive values may indicate overbought conditions
- Extreme negative values may indicate oversold conditions
These conditions often precede trend reversals.
Why Use OsMA Indicator?
The OsMA Indicator is valuable because it:
- Combines trend and momentum analysis
- Clearly visualizes divergence signals
- Helps traders anticipate reversals early
- Works well with other indicators and strategies
Conclusion
The Moving Average of Oscillator (OsMA) Indicator for MT5 is an effective tool for identifying market momentum, divergence, and potential reversals. Its histogram-based approach makes it easy to interpret, while its ability to highlight hidden market signals makes it a valuable addition to any trading strategy.
For best results, combine it with Price Action and other technical indicators to confirm signals and improve accuracy.
1 Download
Published:
Apr 06, 2026 05:22 AM
Category: