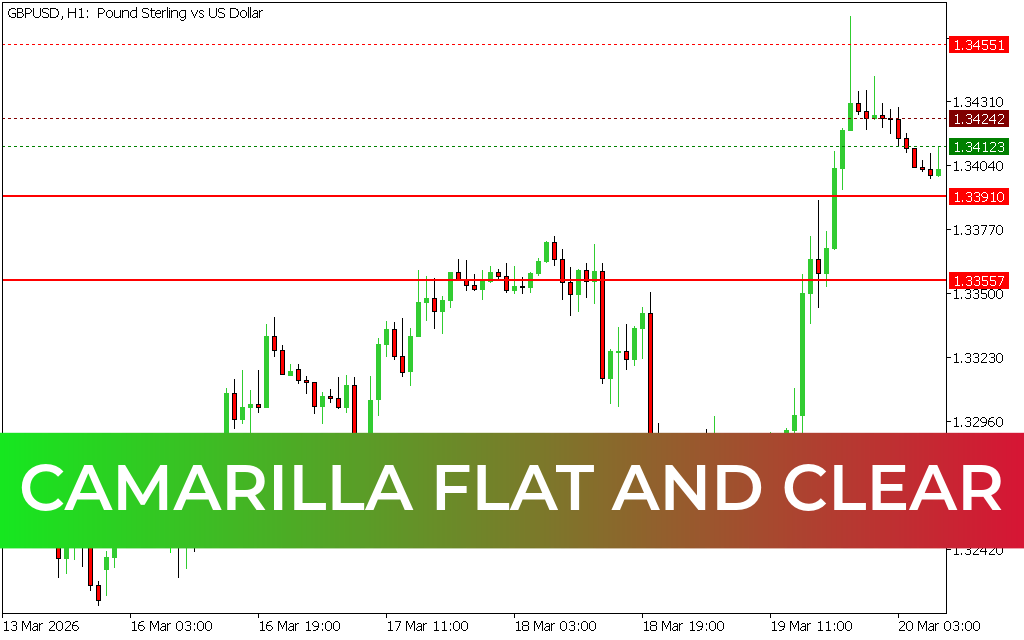
The Camarilla Flat and Clear Indicator for MT5 is a powerful technical analysis tool designed to highlight critical price levels where trend reversals or breakouts are most likely to occur. Built for the MetaTrader 5 trading platform, this indicator uses historical price data to plot precise support and resistance zones.
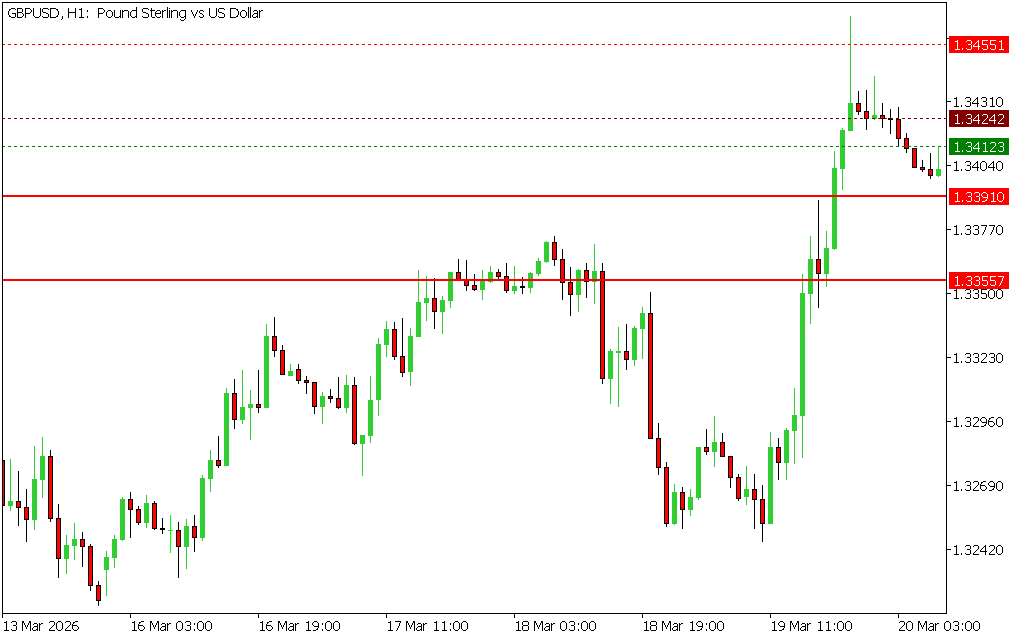
By analyzing the previous day’s trading activity, it provides traders with a clear roadmap of potential market turning points.
What Is the Camarilla Flat and Clear Indicator?
The indicator is based on Camarilla Pivot Levels, a widely used method in Forex trading to identify key price zones. These levels are calculated using the previous day’s:
- High
- Low
- Open
- Close
As a result, the plotted horizontal lines act as strong support and resistance levels, helping traders anticipate price reactions when these zones are tested.
Are Camarilla Levels Accurate?
Camarilla levels are considered highly reliable because they are derived from actual market behavior. Since they reflect past Price Action, they often serve as psychological levels where traders expect reactions.
When price approaches these levels, traders can anticipate:
- Trend reversals
- Breakouts
- Increased market activity
This makes the indicator valuable for both short-term and long-term trading strategies.
Key Features
- Automatically plots support and resistance levels
- Based on previous day’s price action
- Highlights potential reversal and breakout zones
- Fully customizable colors for better visualization
- Suitable for all trading styles and experience levels
How the Indicator Works
The Camarilla Flat and Clear Indicator displays multiple horizontal lines, each representing a key level:
- Green Lines: Potential bullish breakout or reversal zones
- Red Lines: Potential bearish breakout or reversal zones
- Burgundy Line: Central pivot or equilibrium level
These levels act as decision points where traders can evaluate market behavior and plan trades accordingly.
Advantages of Using the Camarilla Indicator
Strong Support and Resistance Zones
The indicator clearly marks important price levels derived from previous highs and lows, making it easier to identify high-probability trading areas.
Trend Identification
Traders can determine market direction based on price interaction with key levels:
- Break above resistance → Potential bullish trend
- Break below support → Potential bearish trend
Versatility
- Works on all timeframes
- Suitable for Scalping, day trading, and swing trading
- Useful for both beginners and advanced traders
Best Trading Practices
To maximize effectiveness:
- Combine with trend indicators for confirmation
- Use price action signals (candlestick patterns) near key levels
- Wait for breakout confirmation to avoid false signals
- Apply proper risk management with stop-loss placement
Conclusion
The Camarilla Flat and Clear Indicator for MT5 is an essential tool for traders looking to identify high-probability support and resistance zones. By leveraging previous price action, it helps anticipate trend reversals and breakouts with greater confidence. When combined with other strategies, it can significantly enhance trading accuracy and decision-making.
Published:
Apr 10, 2026 08:40 AM
Category: