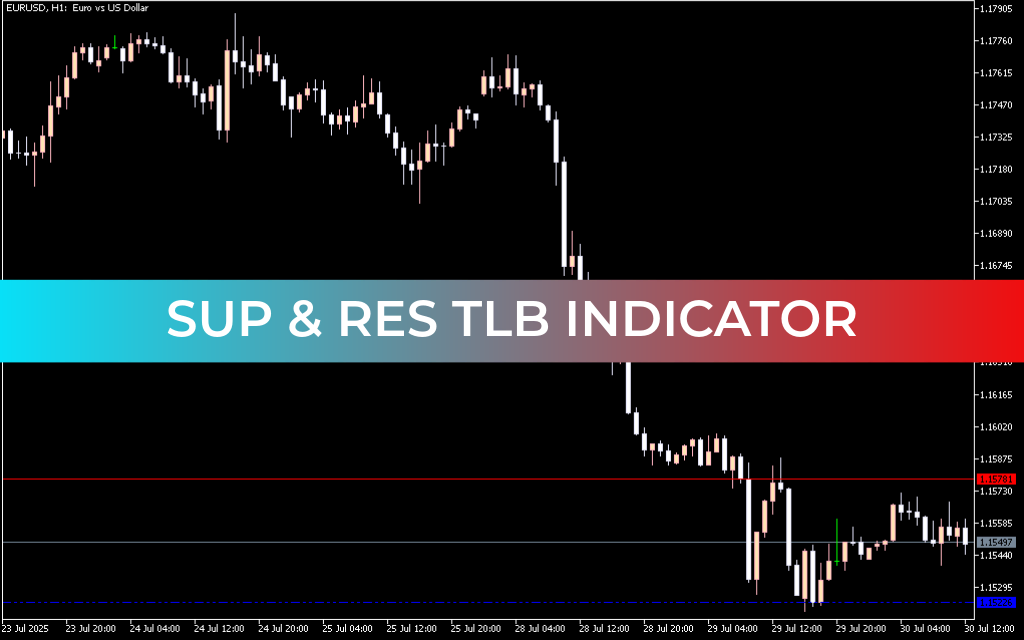
The Sup & Res TLB Indicator for MetaTrader 5, also known as the Support Resistance indicator, is designed to simplify plotting key support and resistance levels across multiple timeframes on a single chart. By displaying daily, weekly, and monthly levels together, traders gain a clearer perspective on high-probability reversal points and trade opportunities.
Ideal for both beginner and experienced traders, this indicator provides an easy-to-read interface while offering flexibility through customizable timeframe settings.
How the Sup & Res TLB Indicator Works
Support and resistance levels mark areas where price has historically reacted—either reversing or consolidating. By combining levels from multiple timeframes, the indicator allows traders to:
- Spot strong confluence zones for high-probability trades
- Identify potential entry and exit points
- Track key reversal areas without manually plotting lines
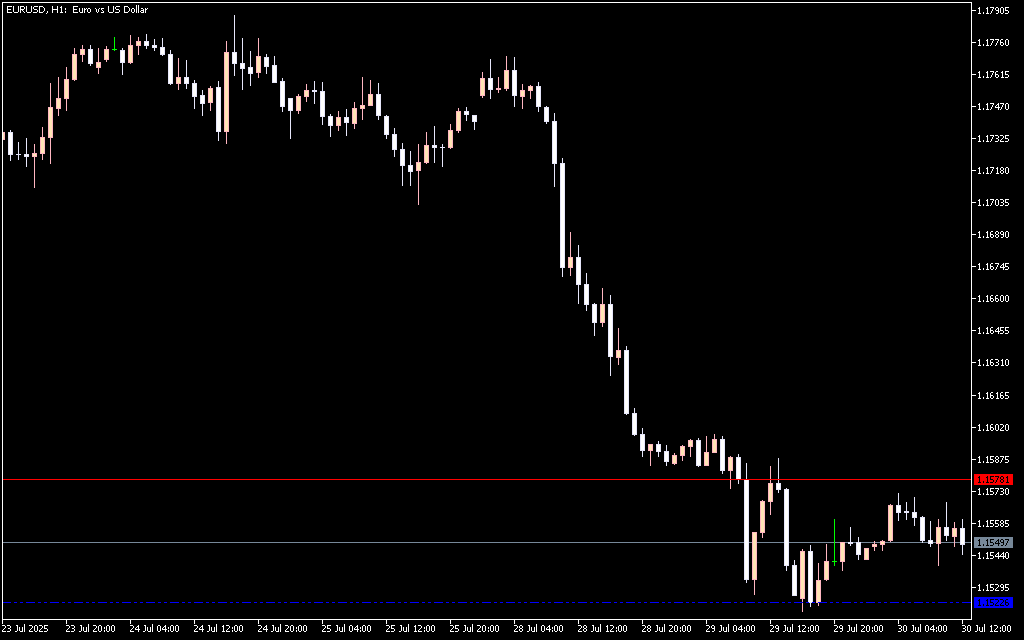
Example Usage:
- On a daily chart, the default settings show daily, weekly, and monthly support and resistance levels.
- Traders can adjust these levels or enable/disable specific timeframes to match their trading style.
- For instance, a reaction at a D1 resistance may present a selling opportunity, while a weekly support can serve as a strong buying zone.
Key Features
- Multi-Timeframe Support & Resistance – Display levels from daily, weekly, and monthly charts simultaneously.
- Customizable Settings – Enable or disable levels for specific timeframes according to your strategy.
- Clear Visual Display – Color-coded lines for easy identification of support and resistance zones.
- Trade Reversal Points – Helps identify high-probability areas for entries and exits.
- Beginner-Friendly – Simple interface and settings make it accessible for new traders.
How Traders Benefit
The Sup & Res TLB Indicator streamlines a critical part of technical analysis: identifying where price is likely to reverse or stall. By seeing multiple timeframes on one chart, traders can:
- Improve timing for entries and exits
- Avoid placing trades against major support or resistance zones
- Quickly assess where price may react based on historical data
- Combine with other indicators for confluence-based strategies
Conclusion
Plotting support and resistance manually can be tedious and error-prone, especially across multiple timeframes. The Sup & Res TLB Indicator for MT5 automates this process, offering a clean, intuitive, and customizable view of key reversal zones. Perfect for spotting trade opportunities, it enhances both intraday and swing trading strategies.
FAQ
Published:
Mar 04, 2026 09:58 AM
Category: