The Fiji Trend Indicator for MetaTrader 5 (MT5) is a powerful technical analysis tool designed to identify market trends, reversals, and momentum shifts with precision. By combining moving averages, ATR (Average True Range), and volatility filters, the indicator provides clear visual signals that help traders identify potential entry and exit points.
Its intuitive design makes it suitable for both beginners and professional traders, offering a simplified way to interpret complex market movements.
How the Fiji Trend Indicator Works
The indicator analyzes Price Action using a hybrid algorithm that merges moving averages with ATR-based volatility calculations. This combination allows the indicator to adapt to changing market conditions and filter out unnecessary noise.
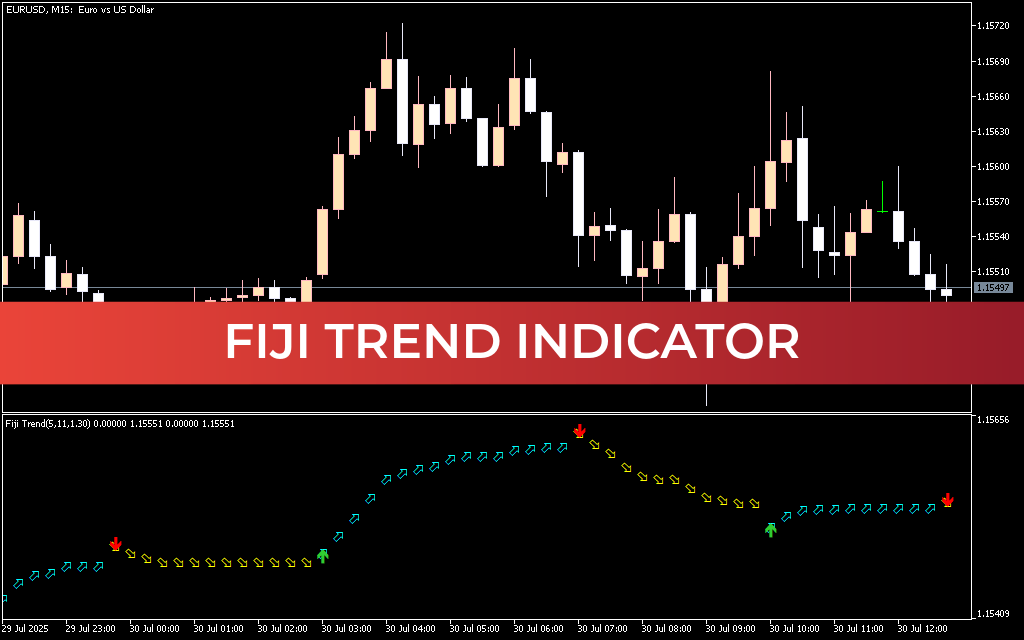
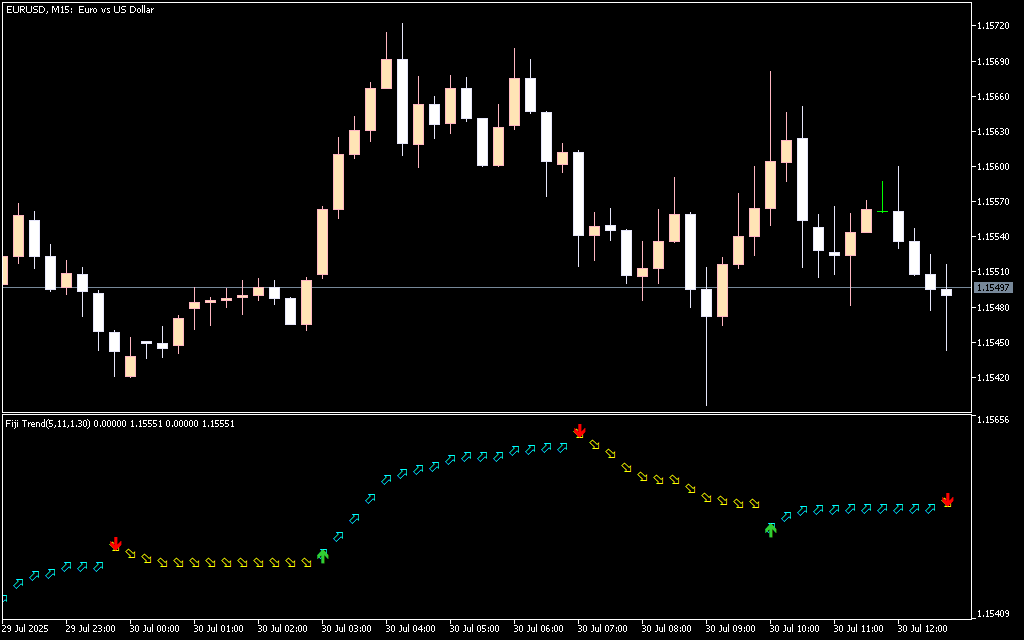
On the chart, the indicator plots colored dots that represent market signals:
- 🟢 Green Dots – Bullish trend (potential buy opportunity)
- 🔴 Red Dots – Bearish trend (potential sell opportunity)
- 🟡 Yellow Dots – Market consolidation or weakening trend
These visual signals help traders quickly determine the current market direction without complex calculations.
Fiji Trend Indicator Trading Signals
📈 Buy Signal
A buy opportunity occurs when the indicator plots green dots on the chart.
Trading Steps:
- Wait for green dots to appear below the price.
- Confirm the market is entering a strong uptrend.
- Open a buy position.
- Place stop loss below the previous swing low.
- Exit the trade when:
- Red dots appear, or
- Price shows strong resistance.
📉 Sell Signal
A sell opportunity occurs when red dots appear above the price.
Trading Steps:
- Wait for red dots to appear.
- Confirm a bearish trend formation.
- Enter a sell trade.
- Place stop loss above the previous swing high.
- Exit when:
- Green dots appear, or
- Market momentum weakens.
⚠️ Yellow Dot Signal (Caution Zone)
Yellow dots indicate transitional market conditions such as:
- Trend weakening
- Market consolidation
- Possible reversal setup
During this phase, traders should avoid opening new trades and wait for a clearer signal.
Key Features of the Fiji Trend Indicator
- Combines Moving Averages and ATR volatility analysis
- Clear visual dot-based signals
- Works in trending and volatile markets
- Filters market noise for accurate signals
- Suitable for Scalping, intraday, and swing trading
- Easy to understand for beginners
Best Timeframes & Markets
The Fiji Trend Indicator performs well on:
- M5 – M30 for scalping
- H1 – H4 for intraday trading
- Daily charts for swing trading
It can be applied to:
- Forex currency pairs
- Crypto markets
- Indices
- Commodities
Conclusion
The Fiji Trend Indicator for MT5 is a highly reliable tool for identifying trend direction and potential reversals. With its combination of moving averages, ATR calculations, and volatility filters, it offers traders clear signals while minimizing false alerts. Whether you are a scalper, day trader, or swing trader, this indicator can significantly improve your trading analysis and decision-making.
FAQ
6 Downloads
Published:
Mar 05, 2026 11:11 AM
Category: