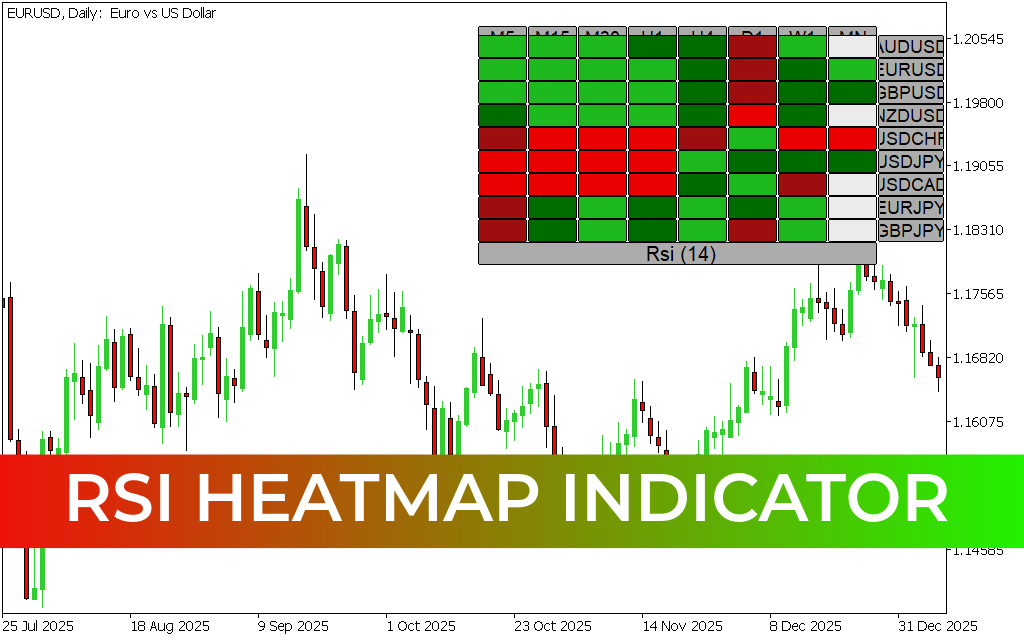
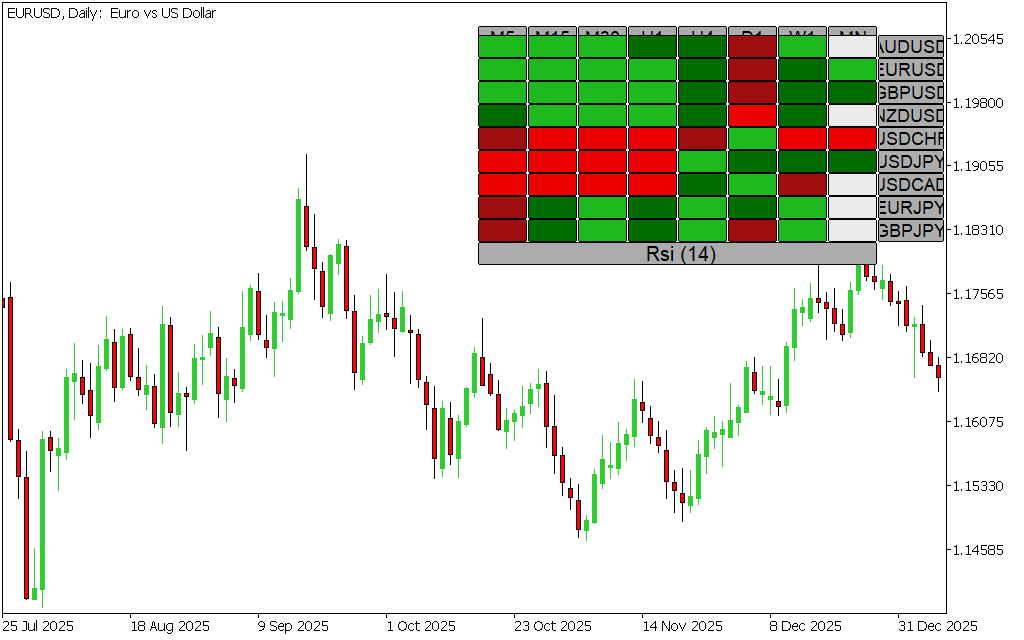
The RSI Heatmap Indicator for MetaTrader 5 is a powerful currency strength tool designed to help Forex traders analyze the strength and weakness of different currencies in real time. It uses the Relative Strength Index (RSI) to calculate momentum and convert it into an easy-to-read heatmap format.
By displaying multiple currencies across different timeframes, this indicator provides a clear visual overview of market strength, helping traders make faster and more accurate trading decisions.
What Is the RSI Heatmap Indicator?
The RSI Heatmap Indicator is a multi-currency strength meter that evaluates RSI values and price direction to determine how strong or weak a currency is.
Instead of analyzing a single chart, it allows traders to view multiple currencies at once, making it easier to identify the strongest and weakest pairs in the market.
Key Features:
- RSI-based currency strength calculation
- Multi-currency and multi-timeframe heatmap
- Real-time visual strength comparison
- Color-coded market analysis
- Suitable for all trading styles
How the RSI Heatmap Works
The indicator assigns different colors to represent currency strength levels:
- Strong bullish strength (Green / Light Green)
- Weak bullish strength (transition colors)
- Weak bearish strength (transition colors)
- Strong bearish strength (Red / Firebrick)
These colors help traders quickly understand which currencies are gaining or losing momentum.
How to Trade with RSI Heatmap Indicator
BUY Strategy:
- Identify a currency showing green to light green transition
- Confirm strength across multiple timeframes
- Match strong currency vs weak currency pair
- Enter a BUY trade
- Use stop loss based on technical structure
SELL Strategy:
- Identify a currency showing red to firebrick weakness
- Confirm weakness across multiple timeframes
- Pair weak currency against strong one
- Enter a SELL trade
- Exit when strength begins to reverse
Multi-Timeframe Strength Confirmation
One of the most powerful features of the RSI Heatmap is its ability to analyze multiple timeframes simultaneously.
Benefits of multi-timeframe analysis:
- Stronger trade confirmation
- Reduced false signals
- Better trend alignment
- Improved entry timing
A consistent color shift across timeframes signals a higher-probability trading setup.
Currency Pair Strength Strategy
Traders can also compare multiple currency pairs to identify market dominance.
For example:
- Compare all GBP pairs to measure GBP strength
- Compare USD pairs to evaluate USD dominance
- Trade the strongest currency against the weakest
This approach helps traders build a currency strength-based trading strategy.
Why Traders Use RSI Heatmap
- Simplifies complex market analysis
- Identifies strongest and weakest currencies quickly
- Improves trade selection accuracy
- Works across all trading timeframes
- Ideal for trend-following strategies
Final Thoughts
The RSI Heatmap Indicator for MT5 is a highly effective currency strength tool that helps traders visualize market momentum in real time. By using RSI-based calculations across multiple currencies and timeframes, it simplifies decision-making and improves trade accuracy.
When combined with technical analysis tools like support/resistance or trend indicators, it becomes a powerful system for selecting high-probability Forex trades.
4 Downloads
Published:
Apr 14, 2026 07:13 AM
Category: