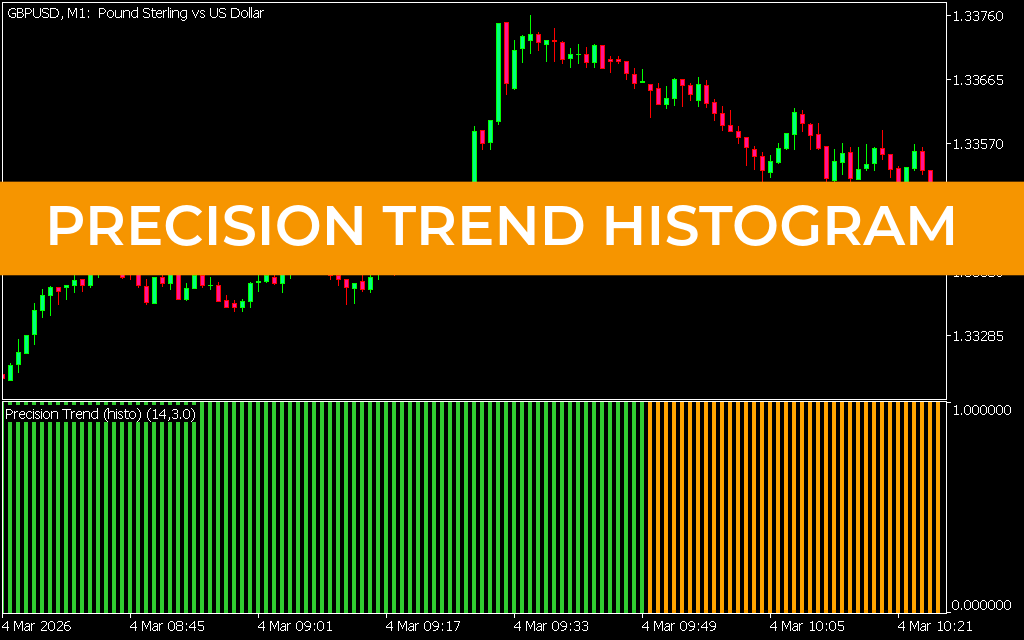
The Precision Trend Histogram Indicator for MT5 is a simple yet effective trend-following tool designed to identify market direction using a color-coded histogram. It helps traders quickly determine whether the market is trending upward or downward without complex analysis.
The indicator is displayed in a separate window below the chart, making it easy to interpret trend conditions at a glance.
What is the Precision Trend Histogram Indicator?
The Precision Trend Histogram Indicator is a technical tool that shows trend direction using colored histogram bars:
- Green bars → Uptrend (bullish market)
- Orange bars → Downtrend (bearish market)
This visual approach makes it easy for traders to identify market momentum and direction.
How Does the Indicator Work?
The indicator analyzes price movement and converts it into a histogram format.
- Increasing green bars → Strong bullish trend
- Increasing orange bars → Strong bearish trend
- Color changes → Possible trend shift or weakening momentum
It is best used on higher timeframes to reduce market noise and false signals.
Key Features of Precision Trend Histogram
- Simple color-based trend identification
- Works across all timeframes
- Best performance on H1, H4, Daily charts
- Helps filter market noise
- Suitable for all trading levels
How to Trade with Precision Trend Histogram
Traders use the histogram color changes to determine entry and exit points.
BUY Signal (Long Entry)
A BUY setup occurs when:
- Histogram shows green bars
- Market is in an upward trend
- Price confirms bullish structure
This indicates strong buying momentum.
SELL Signal (Short Entry)
A SELL setup occurs when:
- Histogram shows orange bars
- Market is in a downward trend
- Price confirms bearish structure
This indicates strong selling pressure.
Trend Reversal Strategy
The indicator can also help identify potential reversals:
- Color change from orange → green may signal a bullish reversal
- Color change from green → orange may signal a bearish reversal
However, traders should always confirm reversals using Price Action before entering trades.
Recommended Usage Tips
- Use on higher timeframes for better accuracy
- Combine with price action or support/resistance levels
- Avoid relying solely on color changes in sideways markets
- Use confirmation indicators for stronger signals
Key Benefits of Precision Trend Histogram
- Easy-to-read visual trend signals
- Helps identify market direction quickly
- Works well for beginners and advanced traders
- Reduces chart analysis complexity
- Useful for trend-following strategies
Conclusion
The Precision Trend Histogram Indicator for MT5 is a straightforward and efficient tool for identifying market trends using color-coded histogram bars. It allows traders to quickly recognize bullish and bearish conditions and make faster trading decisions.
While it works well on its own, combining it with price action or other indicators can significantly improve accuracy.
Best of all, the Precision Trend Histogram Indicator is completely free to download, making it a valuable addition to any trading strategy.
10 Downloads
Published:
Apr 11, 2026 05:17 AM
Category: