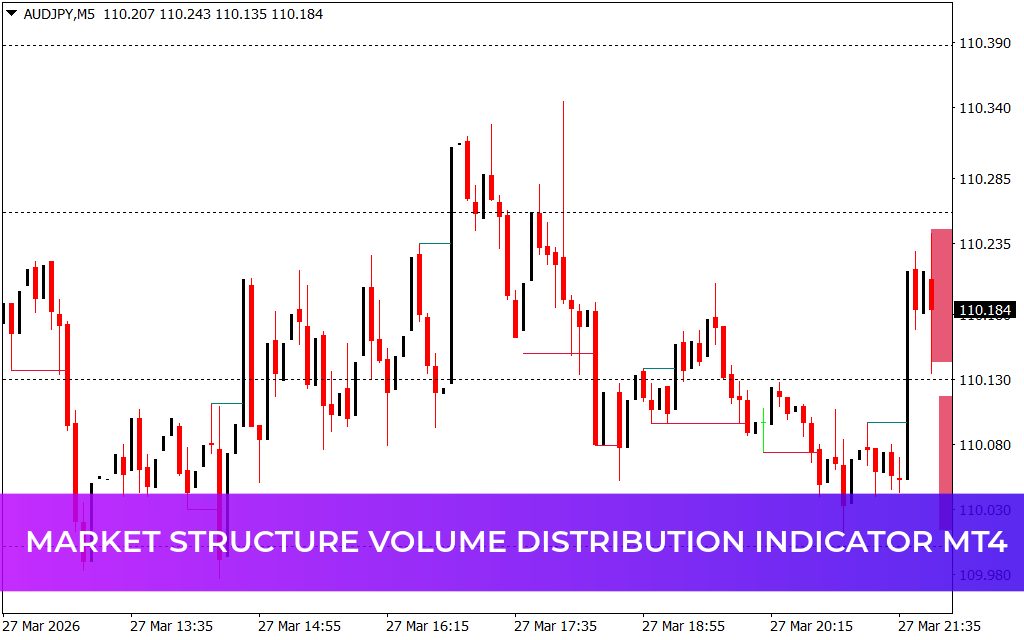
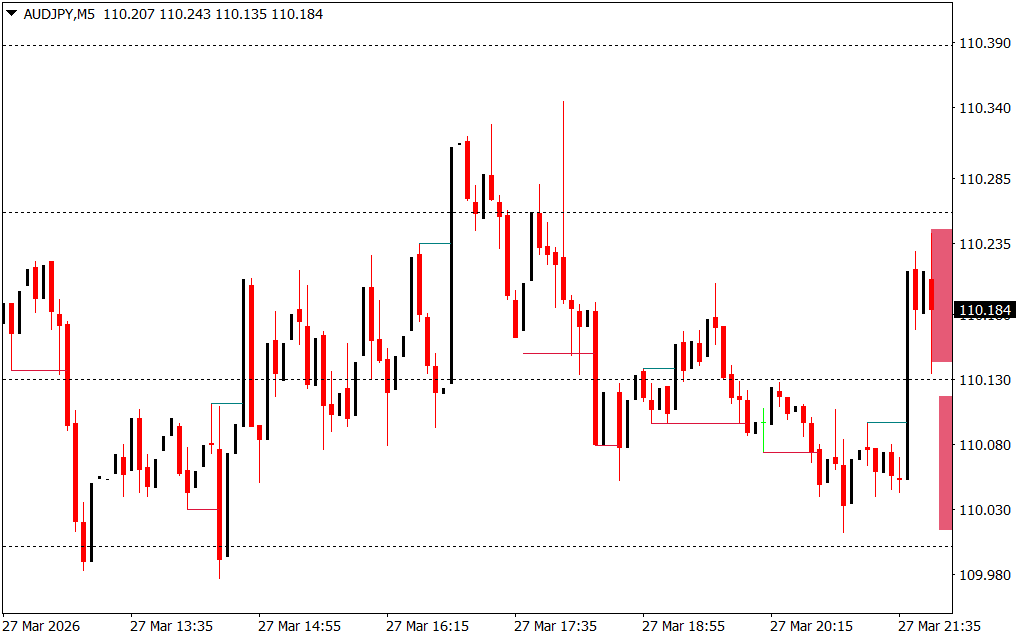
The Market Structure Volume Distribution Indicator by LuxAlgo is a powerful trading tool that visualizes how trading volume is distributed across price levels, rather than merely per candle. This allows traders to see where buying and selling activity is concentrated, providing insights into support, resistance, and key Liquidity Zones within the market structure.
By combining market structure analysis with volume profiling, this indicator gives traders a precise view of where major market participants are active, helping to anticipate potential price reactions.
How the Market Structure Volume Distribution Indicator Works
Unlike traditional volume indicators, this tool focuses on price-based volume within the market structure:
- Horizontal Volume Profile: Displays volume distribution next to the price chart.
- Green/teal bars: Represent buying volume.
- Red bars: Represent selling volume.
- Volume Clusters: Highlight areas where trading activity was particularly concentrated, often acting as support or resistance zones.
- Pivot-Based Structure: Links volume analysis to meaningful swings and market turning points, ensuring that volume insights align with the broader market structure.
By analyzing the balance of buying and selling at specific price levels, traders can anticipate where price may react strongly in the future.
Trading Applications
The Market Structure Volume Distribution Indicator is ideal for traders seeking institutional-level insight:
- Identify Support And Resistance Zones:
- Heavy buying volume clusters often signal potential support.
- Strong selling volume clusters indicate potential resistance.
- Spot Liquidity Zones:
- High-volume areas show where many orders were executed, often attracting price when revisited.
- Trend Confirmation:
- Compare volume distribution with price swings to determine which side—buyers or sellers—is dominant.
- Enhance Risk Management:
- Use volume clusters to place stop-losses or target levels around areas of high liquidity concentration.
- Combine with Other Tools:
- Works well alongside Price Action analysis, support/resistance levels, and trend indicators for a comprehensive trading approach.
Key Benefits
- Visualizes Real Trading Activity: Shows where buying and selling are actually concentrated, not just candle totals.
- Integrates Market Structure: Focuses on volume within meaningful price swings, avoiding random noise.
- Highlights Key Liquidity Zones: Helps anticipate price reactions at high-volume areas.
- Professional Trading Insights: Designed for traders who want a structured, data-driven edge in market analysis.
- MT4 Compatible: Automatically plots volume distribution alongside price without manual effort.
Conclusion
The Market Structure Volume Distribution Indicator by LuxAlgo provides traders with a clear and actionable view of volume within market structure. By highlighting buying and selling clusters, it identifies zones that are likely to influence future price action.
This tool goes beyond traditional price charts—it reveals where real trading activity occurs, helping traders make smarter entries, exits, and risk management decisions. Combined with price action, support/resistance, and trend confirmation strategies, it’s a valuable addition to any professional trading workflow.
FAQ
3 Downloads
Published:
Mar 29, 2026 10:06 AM
Category: