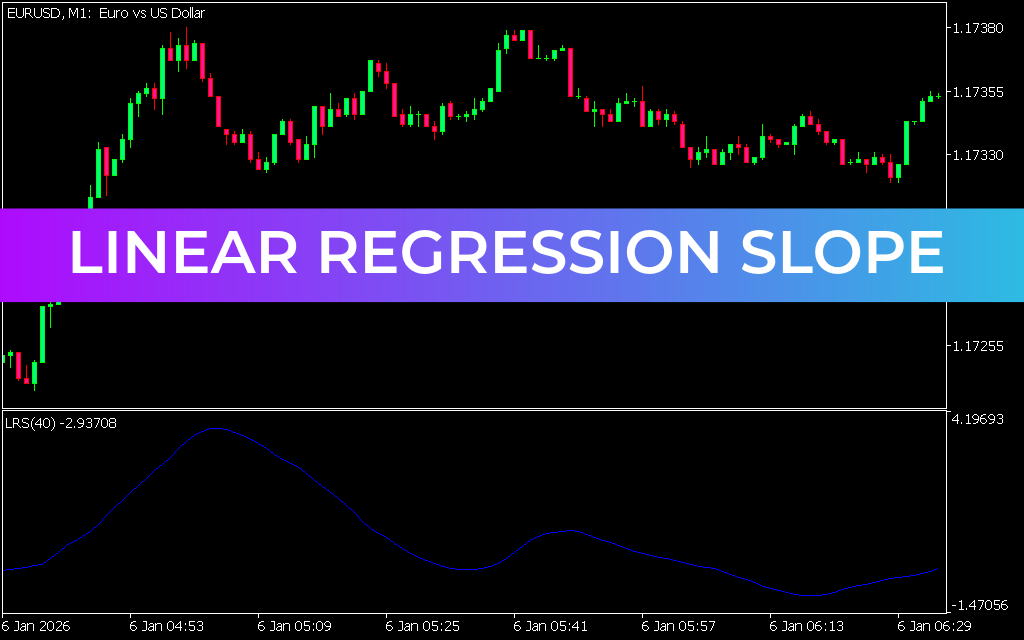
The Linear Regression Slope Indicator for MT5 is a powerful momentum-based tool that calculates a linear regression line and plots its slope to help traders evaluate Trend Strength and direction. By visualizing momentum as a simple line, this indicator makes it easy to identify when a trend is gaining strength or losing momentum.
Unlike traditional indicators, the Linear Regression Slope focuses purely on the rate of change, giving traders a clearer picture of market dynamics and potential entry or exit points.
How the Linear Regression Slope Indicator Works
The indicator displays a single line (typically blue) that oscillates around a zero level:
- Above zero: Indicates bullish momentum
- Below zero: Indicates bearish momentum
- Near zero: Signals weak or ranging market conditions
The distance of the line from the zero level reflects the strength of the trend. The further it moves away, the stronger the momentum. When the line returns toward zero, it suggests weakening momentum or consolidation.
Why Use the Linear Regression Slope Indicator?
This indicator is especially useful for traders who want to:
- Measure trend strength in real time
- Identify early momentum shifts
- Avoid trading in low-volatility or sideways markets
- Improve entry and exit timing
Its simplicity makes it suitable for both beginners and advanced traders, while its accuracy makes it a valuable addition to any trading strategy.
Trading Signals Explained
The Linear Regression Slope Indicator generates clear and actionable signals based on zero-line crossovers:
Buy Signal
- The indicator crosses above the zero line
- The slope continues upward, confirming increasing bullish momentum
- Exit: When the line drops sharply and falls back below zero
Sell Signal
- The indicator falls below the zero line
- Downward slope confirms strengthening bearish momentum
- Exit: When the line reverses direction and moves upward
Interpreting Market Conditions
- Strong Uptrend: Line rises significantly above zero
- Strong Downtrend: Line drops far below zero
- Sideways Market: Line fluctuates around zero
During low-momentum phases, it is generally better to avoid trading, as signals may be unreliable.
Practical Example
On an EUR/USD H4 chart, the indicator closely follows price momentum:
- During uptrends, the slope rises steadily above zero
- During downtrends, it drops below zero with increasing intensity
- In ranging markets, it fluctuates near the zero line, signaling indecision
This behavior helps traders align their trades with the dominant market momentum.
Best Practices for Better Results
To maximize the effectiveness of the Linear Regression Slope Indicator:
- Combine it with Price Action or support/resistance levels
- Use higher timeframes to confirm trend direction
- Avoid trading during low-momentum (flat) conditions
- Apply proper risk management strategies
Final Thoughts
The Linear Regression Slope Indicator for MT5 is a straightforward yet highly effective tool for identifying trend direction and momentum strength. By focusing on the slope of price movement, it provides traders with timely signals and a deeper understanding of market behavior.
When used alongside other technical tools, it can significantly enhance trading accuracy and decision-making.
Published:
Apr 13, 2026 11:23 AM
Category: