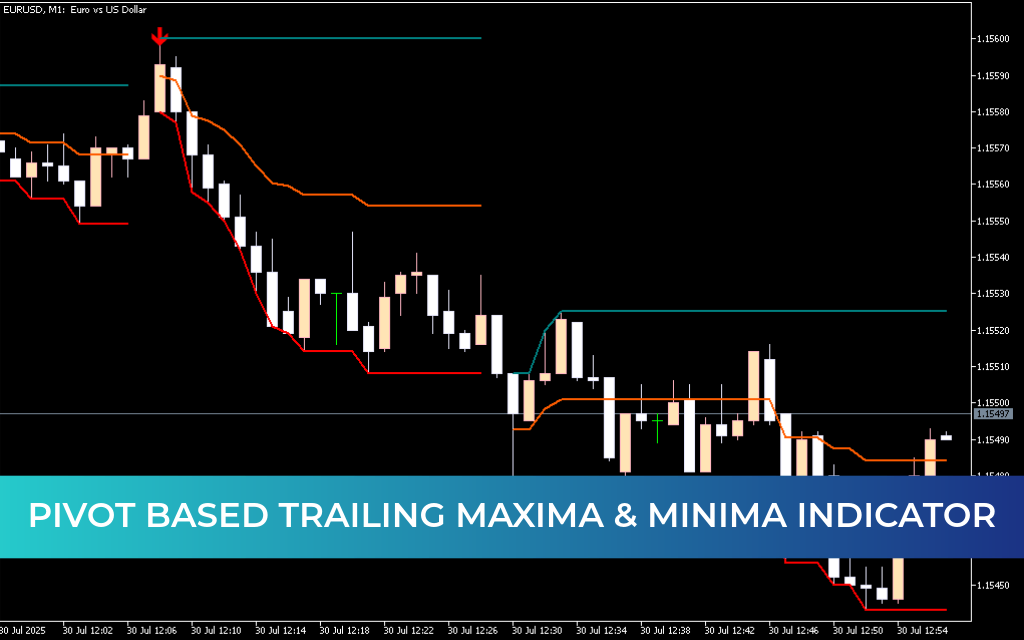
The Pivot Based Trailing Maxima & Minima Indicator for MetaTrader 5 by LuxAlgo is a powerful visual tool that tracks recent swing highs and lows in real time. By leveraging pivot logic, it plots trailing support and resistance levels that adjust dynamically as new price extremes form, helping traders follow Market Structure and adapt to trend shifts. This indicator is especially useful in volatile or trending markets, providing tactical insights for trend-following, breakout, and reversal strategies.
How the Pivot Based Trailing Maxima & Minima Indicator Works
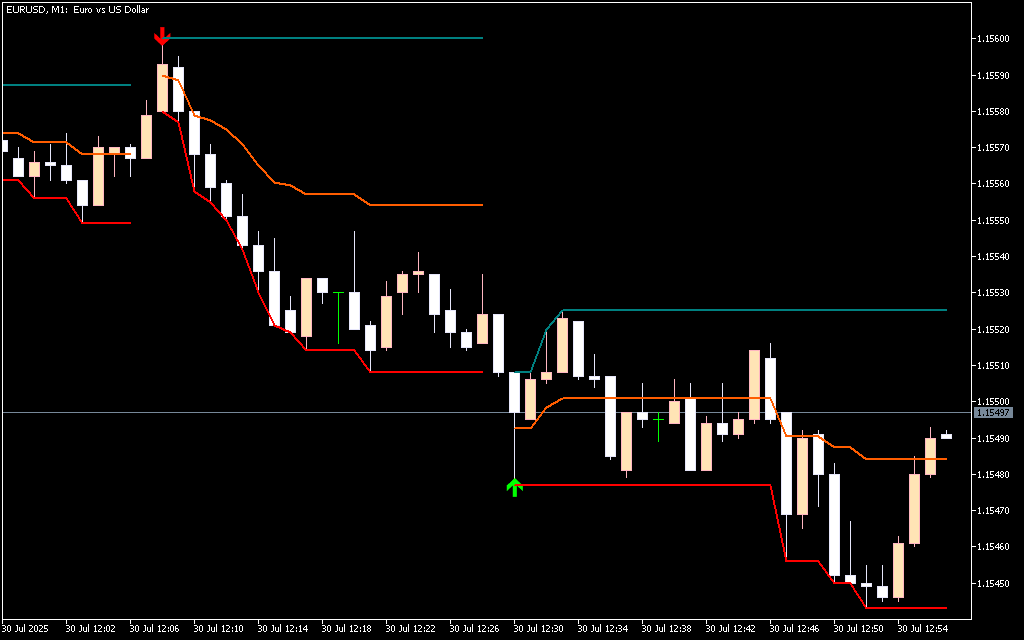
Rather than generating traditional buy or sell signals, the indicator provides a real-time visual trail of market pivots:
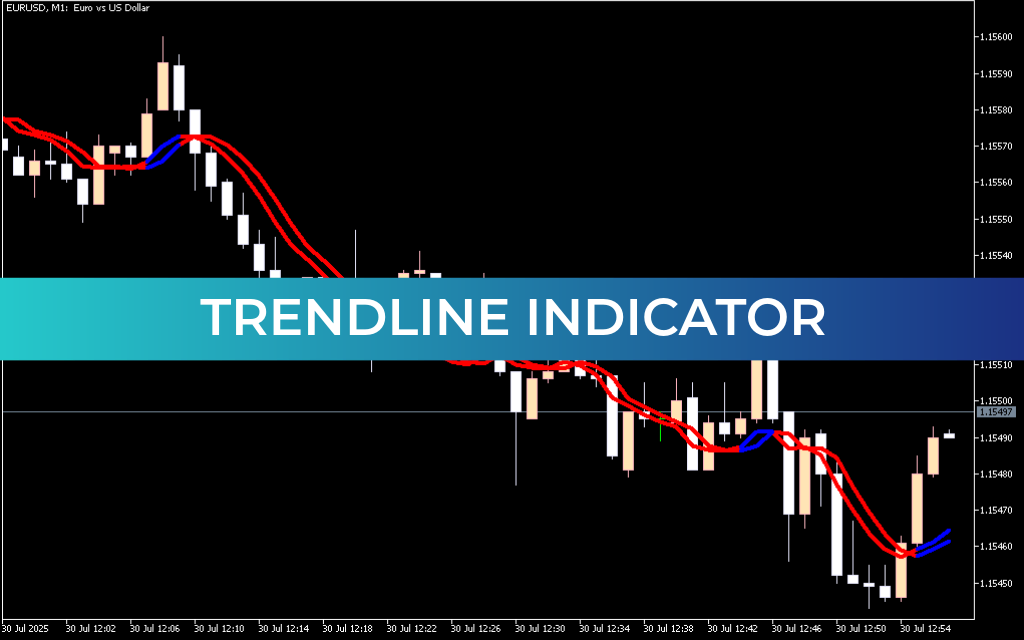
- Trailing Highs: Red arrows and upper bands mark newly formed swing highs, signaling short-term resistance.
- Trailing Lows: Green arrows and lower bands indicate recent swing lows, suggesting active support.
- Dynamic Adjustment: Levels automatically update with new pivots, reflecting the current market structure.
Traders can use these markers to guide stop-loss placement, confirm trend direction, or identify potential breakout or reversal zones when price interacts with these bands.
Benefits for Traders
- Visually tracks swing highs and lows in real time.
- Helps identify dynamic support and resistance zones.
- Supports trend-following, breakout, and reversal strategies.
- Guides stop-loss placement and trade management.
- Works in trending and ranging markets to define reaction zones.
Why Use the Pivot Based Trailing Maxima & Minima Indicator
The Pivot Based Trailing Maxima & Minima Indicator MT5 is a clean, efficient tool for following market pivots and structure. Its real-time adaptability and visual clarity make it ideal for traders relying on trend continuation setups, pullback entries, or breakout strategies. By highlighting active support and resistance dynamically, it helps traders stay aligned with current market movements and make informed decisions.
FAQ
3 Downloads
Published:
Mar 01, 2026 14:36 PM
Category: