Free
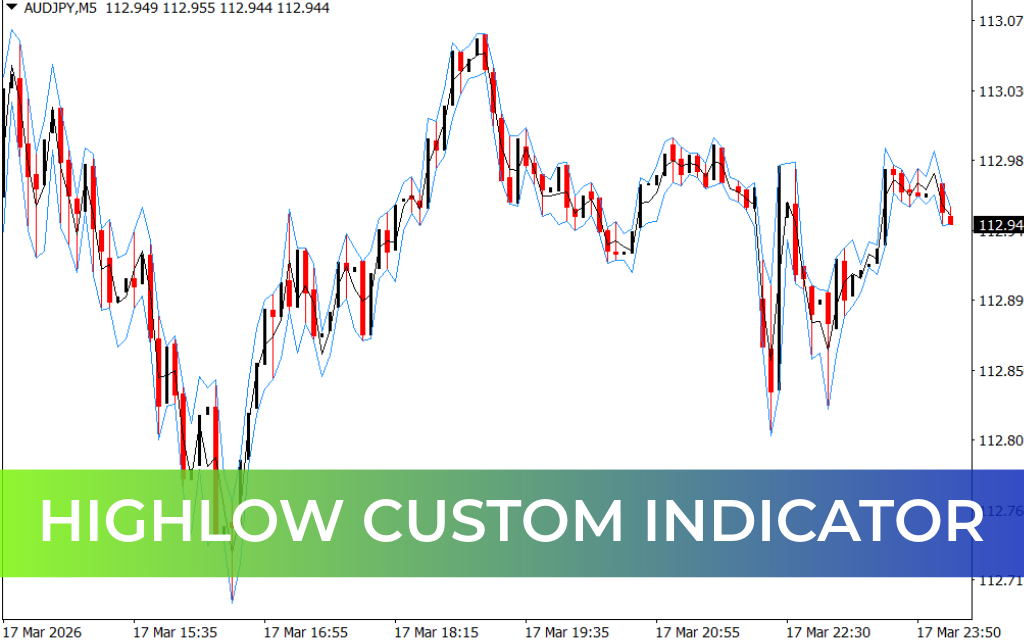
The HighLow Custom Indicator for MT4 is a multi-timeframe (MTF) tool designed to monitor the recent highs and lows of the price. It is ideal for swing traders, breakout traders, and trend-following strategies, helping traders visually spot key support, resistance, and reversal areas.
How the HighLow Custom Indicator Works
- Bands and Midline:
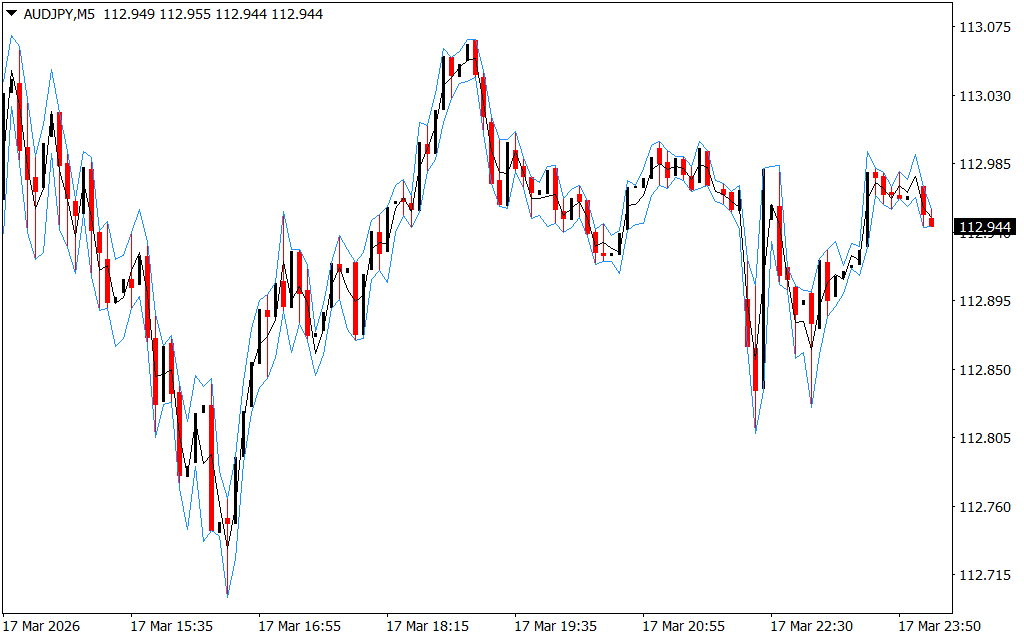
- Upper band: Connects recent highs → potential resistance.
- Lower band: Connects recent lows → potential support.
- Mid-band: Average of highs and lows → shows market equilibrium.
- Fits all timeframes in MT4, making it versatile for intraday or long-term trading.
- Does not provide direct buy/sell signals but highlights key price zones.
How to Use the Indicator for Trading
Buy Signals
- Price rejects the lower band (support) → look for bullish candlestick confirmation.
- Enter a long trade at the breakout of the bullish candle’s high.
- Optional: Add to the position if the price remains above the mid-band.
- Stop-loss: Set just below the support zone or lower band.
- Take-profit: Consider the upper band as resistance.
Sell Signals
- Price hits the upper band (resistance) → look for bearish candlestick rejection.
- Enter a short trade after confirmation of price rejection.
- Stop-loss: Set above the resistance zone or upper band.
- Take-profit: Consider the lower band as support.
Breakout Trading
- During consolidation, treat the upper and lower bands as breakout levels:
- Go long when the market-high is broken.
- Go short when the market-low is broken.
Example
- Price touches the lower band → forms a strong bullish candlestick → buy triggered at the candle’s high.
- Price approaches the mid-band → can add positions or monitor trend continuation.
- During a ranging market, breakout occurs at the upper band → signals a possible long trade.
Conclusion
The HighLow Custom Indicator is an essential tool for traders who want:
- Visual identification of Support And Resistance zones
- Assistance in swing and breakout trading
- Multi-timeframe adaptability
- Insight into price reversal areas and consolidation breakouts
While it does not give direct buy/sell arrows, it is extremely useful in enhancing trading decisions by outlining critical price levels for strategic entries and exits.
FAQ
Upper chord of recent highs, lower chord of lows, mid equilibrium line averaging both for mean reference.
No direct buy/sell—zones only; trader supplies candle confirmation at rails.
Bounce confirmation off lower support band with optional mid-band participation filter and upper band profit magnet.
Upper band rejection with bearish confirm and lower band as extended objective mirror logic.
Project higher timeframe extremes onto execution chart for breakout and swing planning synergy.
Published:
Mar 17, 2026 19:12 PM
Category:
Share: