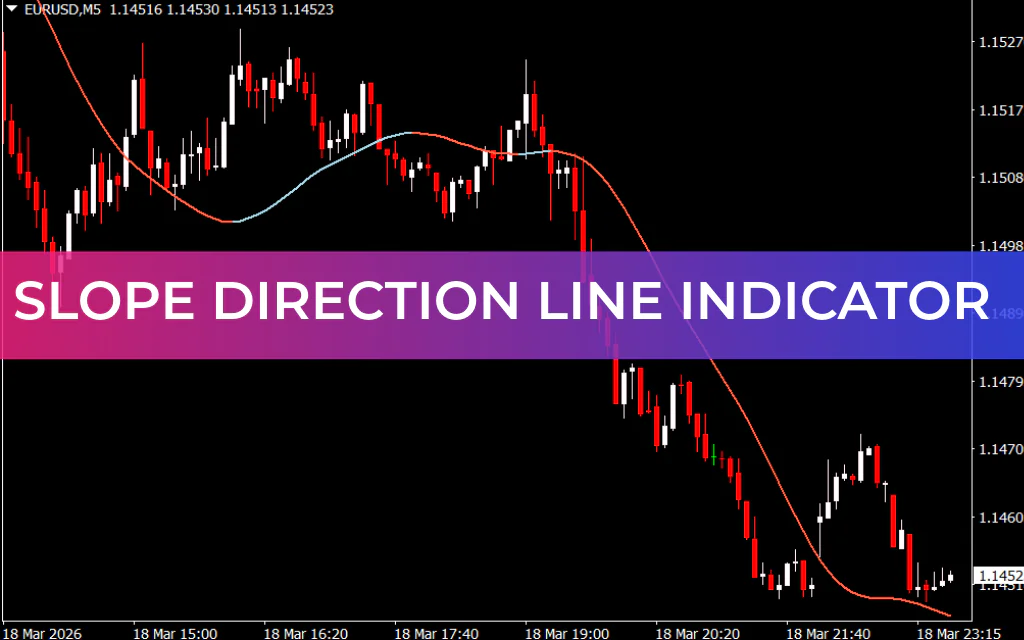
The Slope Direction Line Indicator for MT4 is a popular trend-following tool that provides clear visual forex trading signals by changing its color when the market direction shifts. This makes it easier for traders to identify bullish and bearish market conditions without complex analysis.
The indicator works by analyzing the slope of the trend line. When the slope changes direction, the indicator automatically changes its color, signaling a potential Trend Reversal. As long as the line maintains the same color, it indicates that the current trend is still strong and continuing.
Because of its simplicity and clarity, the Slope Direction Line Indicator is suitable for both beginner and experienced forex traders.
How the Slope Direction Line Indicator Works
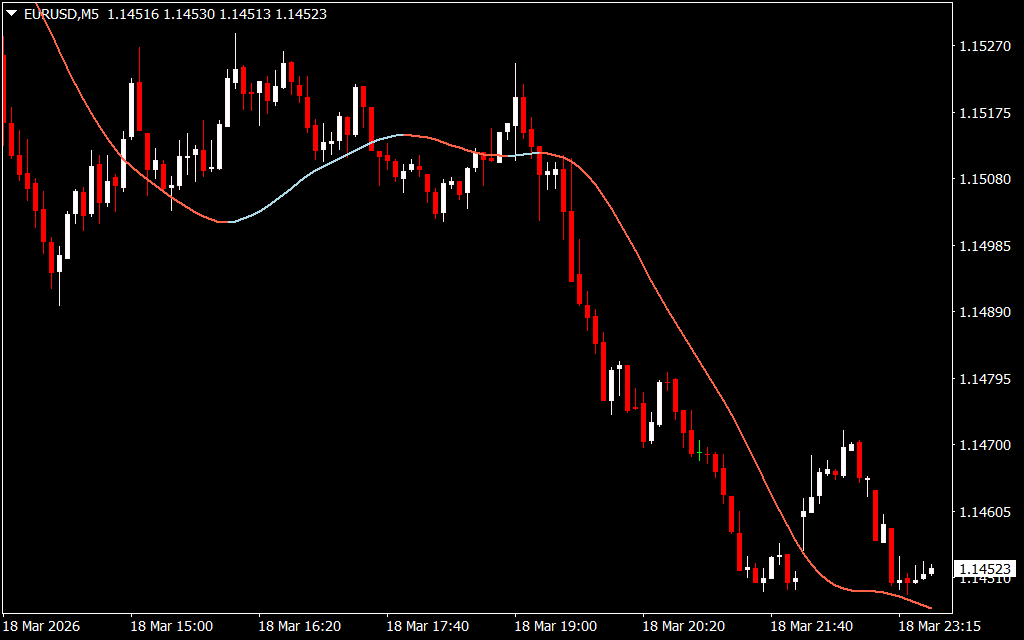
The indicator displays a line directly on the chart that changes color depending on the current market trend:
- Blue Line: Indicates a bullish trend (upward market movement).
- Red Line: Indicates a bearish trend (downward market movement).
When the slope moves upward, the line turns blue, signaling that buyers are gaining control. Conversely, when the slope moves downward, the line turns red, indicating that sellers are dominating the market.
If the line color remains unchanged for a longer period, it suggests trend continuation, allowing traders to hold their positions and capture larger price movements.
Flexible for All Trading Styles
One of the major advantages of the Slope Direction Line Indicator is its flexibility across multiple trading styles. It works effectively on:
- Intraday charts
- Daily charts
- Weekly charts
- Monthly charts
This makes it ideal for different types of traders, including:
- Scalpers
- Short-term traders
- Swing traders
- Long-term investors
Traders can also adjust the period settings of the indicator to control the frequency of trading signals. Shorter periods produce more signals, while longer periods provide smoother and more reliable trends.
Slope Direction Line Indicator Trading Signals
The indicator visually highlights trend direction, making it easy to identify potential entry and exit points.
Bullish Signal (Buy Setup)
- The slope line changes color to blue.
- This indicates the start of a bullish market trend.
- Enter a buy trade after the signal confirmation.
- Place a stop-loss below the previous swing low.
- Exit the trade when the indicator changes to a red signal.
Bearish Signal (Sell Setup)
- The slope line changes color to red.
- This signals the beginning of a bearish trend.
- Enter a sell trade after confirmation.
- Place a stop-loss above the previous swing high.
- Close the trade when the indicator switches back to blue.
Multi-Timeframe Trading Strategy
The Slope Direction Line Indicator can also be used in multi-timeframe analysis to improve trading accuracy.
A common strategy is:
- Identify the main trend on a higher timeframe (such as H4 or Daily).
- Use a lower timeframe (such as H1 or M30) to find the best entry points.
Typically, the trend timeframe should be four times higher than the entry timeframe for better analysis.
Conclusion
The Slope Direction Line Indicator for MT4 is a simple yet effective tool for identifying trend direction and potential market reversals. Its color-changing line makes it easy for traders to recognize bullish and bearish conditions instantly.
While the indicator works well on its own, traders often achieve better results by combining it with Support And Resistance levels, channels, or other technical indicators to confirm trend changes.
With adjustable settings and compatibility across multiple timeframes, this indicator is an excellent addition to any forex trading strategy.
FAQ
1 Download
Published:
Mar 18, 2026 18:37 PM
Category: