The DMI Oscillator Indicator for MT4 is a powerful technical tool designed to help traders identify overbought and oversold levels, determine Trend Strength, and predict potential price movements. Built on the Directional Movement Index (DMI), the indicator uses DI+ and DI- lines to highlight market momentum and direction.
It is especially effective for reducing false signals and can be combined with other indicators like RSI, Bollinger Bands, Moving Averages, and Linear Regression for more accurate trading decisions.
What Is the DMI Oscillator Indicator?
The DMI Oscillator Indicator measures both trend strength and direction using DMI values:
- DI+ (Directional Indicator Positive) – Represents upward movement
- DI- (Directional Indicator Negative) – Represents downward movement
- ADX (Average Directional Index) – Measures the strength of the trend
By analyzing these values, traders can determine whether to continue with a trade or pull back.
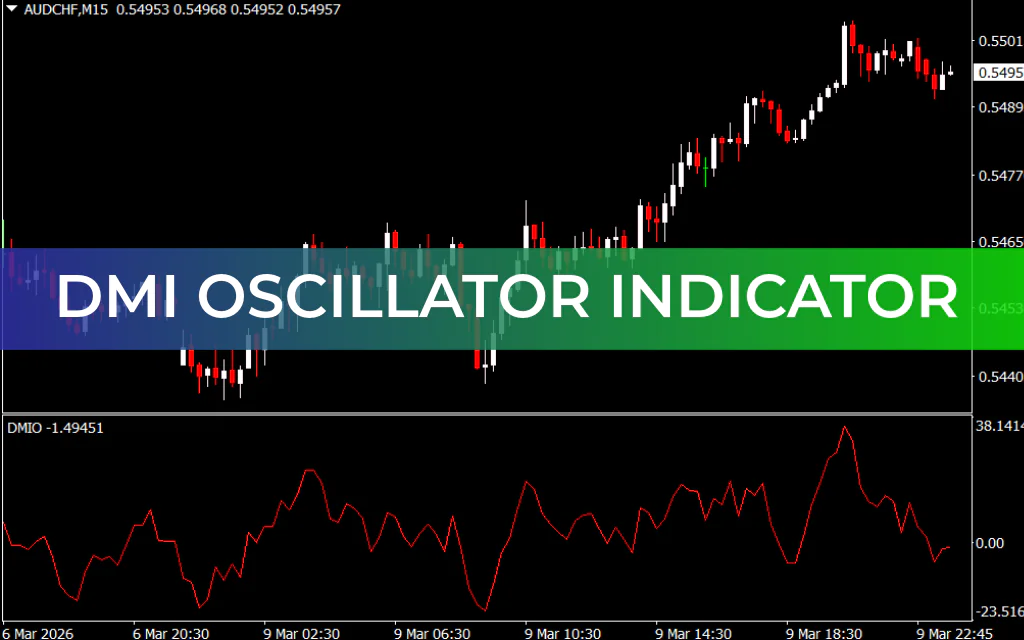
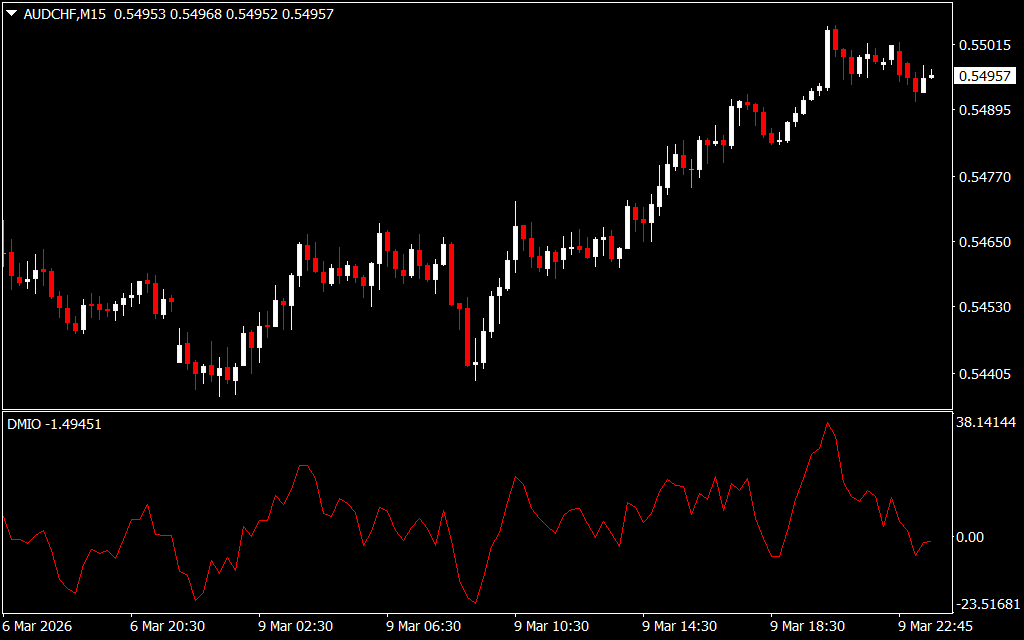
How the DMI Oscillator Indicator Works
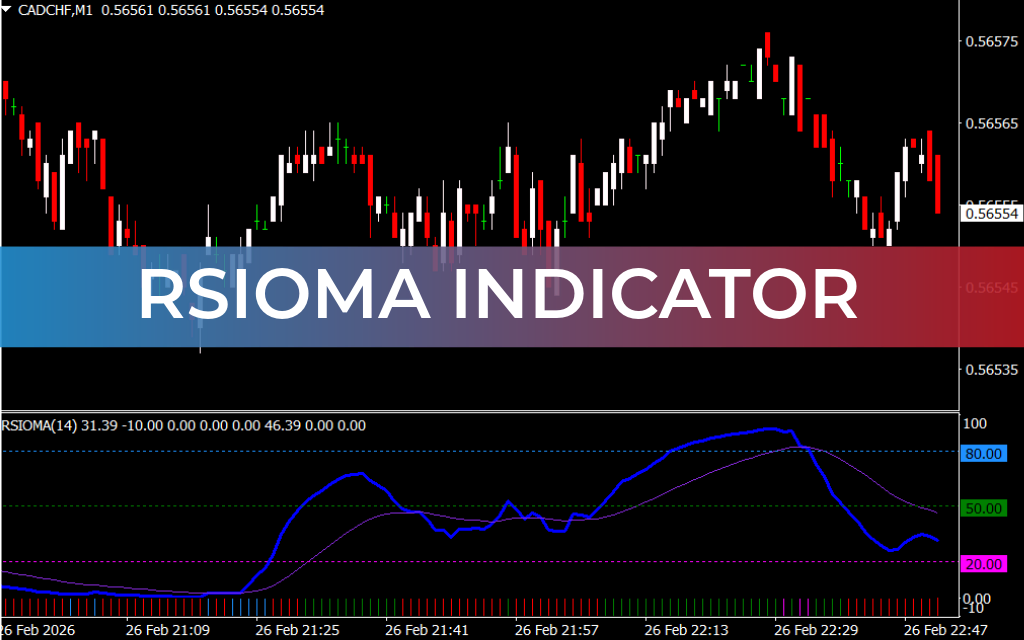
The indicator is displayed as red and blue bars and a fluctuating signal line in a separate chart window.
BUY Signal
- When the red line drops below the green region, it indicates weak selling pressure.
- Traders may consider opening a BUY/LONG trade after confirmation from other indicators.
SELL Signal
- When the red line peaks above the green region, it indicates strong selling pressure.
- Traders may consider opening a SELL/SHORT trade using additional confirmations.
This approach allows traders to capitalize on market trends while avoiding false signals.
Key Features of the DMI Oscillator Indicator
- Highlights overbought and oversold levels
- Measures trend strength and direction
- Uses DI+ and DI- values to reduce false signals
- Compatible with other indicators like RSI, Bollinger Bands, and Moving Averages
- Suitable for all traders – novice, intermediate, and advanced
Best Practices
- Use alongside Trend Confirmation indicators for higher accuracy
- Combine with risk management techniques, including stop-loss and take-profit levels
- Apply on multiple timeframes to confirm trends
Conclusion
The DMI Oscillator Indicator for MT4 is a reliable tool to analyze market direction, trend strength, and overbought/oversold conditions. By comparing DI+ and DI- values, it provides clear BUY and SELL signals that help traders make informed decisions.
You can download the DMI Oscillator Indicator for MT4 for free and use it to enhance your forex trading strategy.
FAQ
Published:
Mar 09, 2026 18:47 PM
Category: