The Better Overbought Oversold (BOO) Indicator for MetaTrader 4 (MT4) is a simple oscillator designed to identify overbought and oversold market conditions. Its layout is similar to the RSI, making it easy for traders to interpret signals and time their trades.
What Is the BOO Indicator?
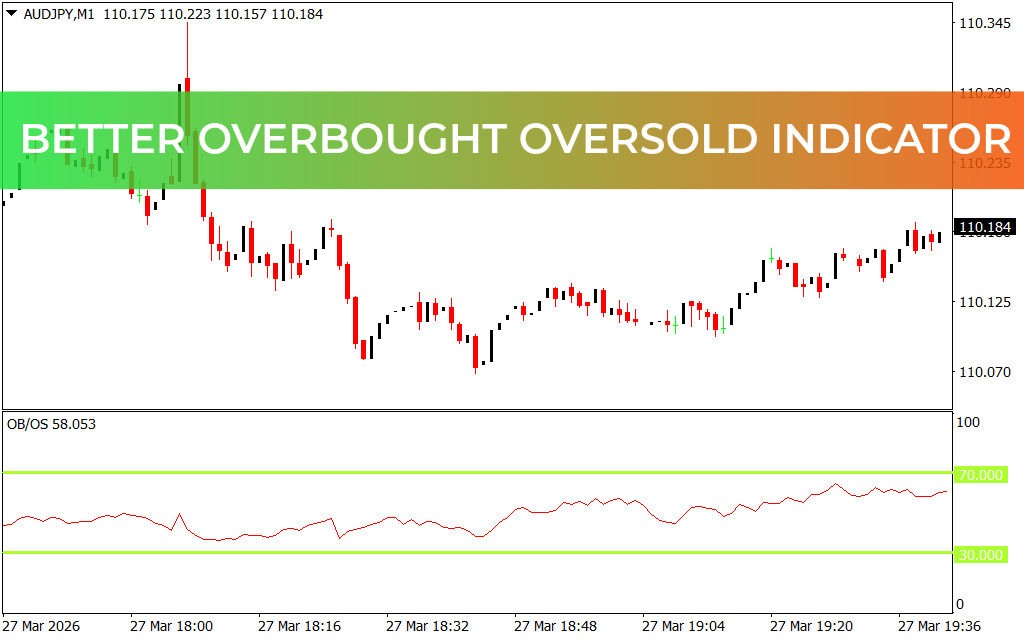
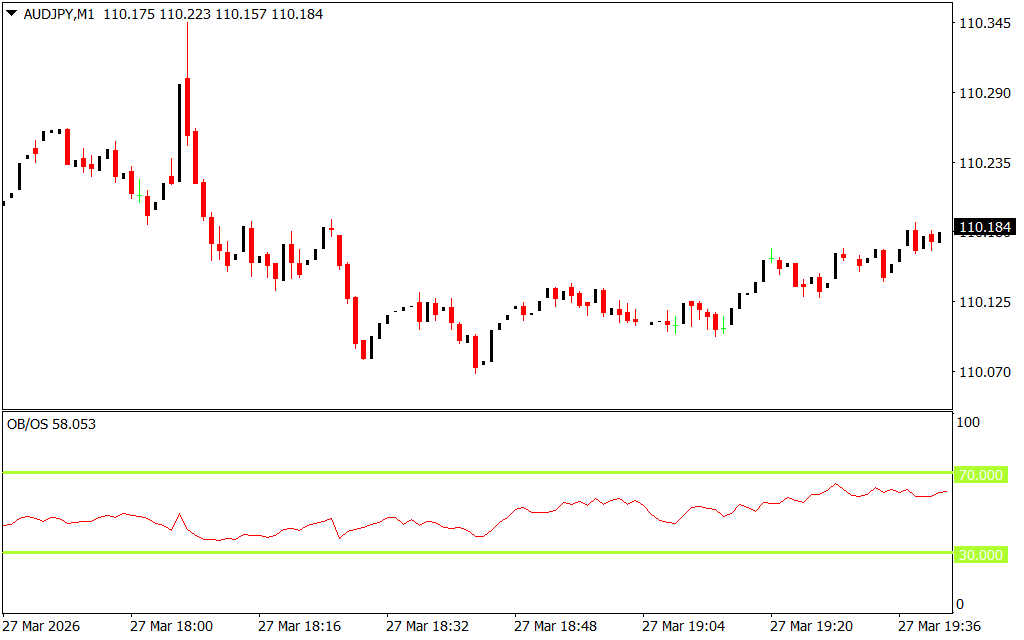
The BOO Indicator uses a single moving average line and a signal line to track market momentum:
- Oscillation Range: 0–100
- Overbought Zone: Above 70 → potential market reversal downward
- Oversold Zone: Below 30 → potential market reversal upward
The indicator also includes visual bars to highlight prevailing overbought and oversold levels, helping traders quickly identify trading opportunities.
How to Use the BOO Indicator in MT4
- Identify BUY/SELL Signals:
- Overbought (Above 70): Consider selling or exiting long positions
- Oversold (Below 30): Consider buying or exiting short positions
- Optimal Timeframes:
- Works on all timeframes
- Best applied on daily or weekly charts for more reliable signals
- Lower timeframes may produce false signals during Scalping or intra-day trading
- Combine with Other Indicators:
- Use alongside RSI, MACD, or other momentum/trend indicators
- Confirms market direction and reduces false signals
- Trading Example:
- On a GBP/USD H4 chart, the BOO line rises above 70 → trader prepares to sell
- The line falls below 30 → trader prepares to buy
Key Benefits
- Simple and intuitive overbought/oversold visualization
- Provides clear BUY and SELL signals
- Works on any MT4-compatible instrument
- Free and lightweight, easy to install
- Helps identify potential trend reversals and entry/exit points
Conclusion
The Better Overbought Oversold (BOO) Indicator for MT4 is an easy-to-use tool for spotting market reversals. By plotting overbought and oversold levels, it offers actionable buy and sell signals while giving traders a clear view of overall market conditions. Pair it with other indicators like RSI or MACD for enhanced trading accuracy.
FAQ
Published:
Mar 28, 2026 19:22 PM
Category: