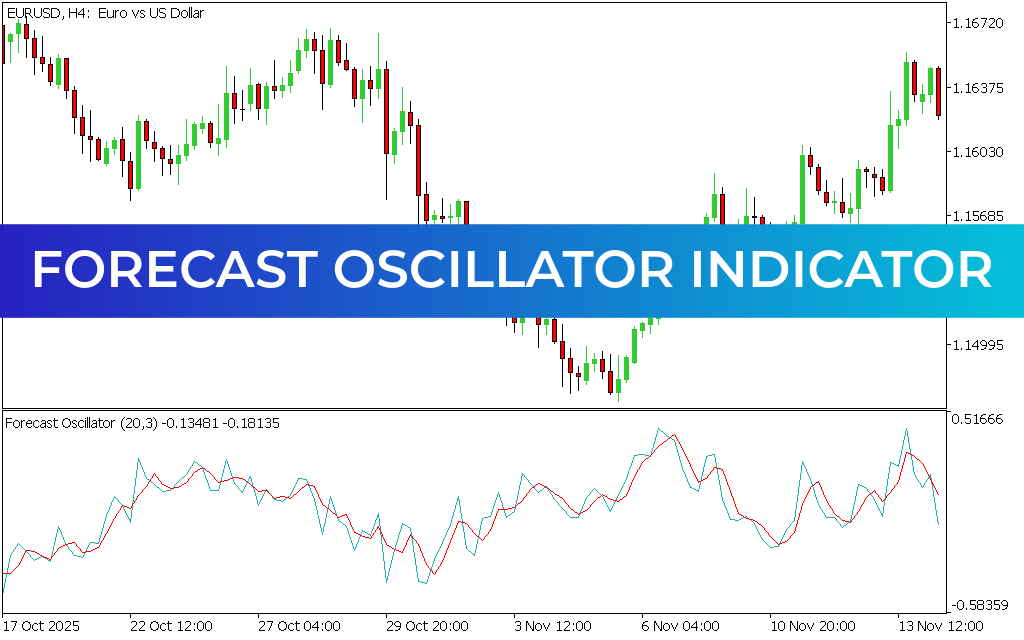
The Forecast Oscillator Indicator for MT5 is a technical analysis tool that uses linear regression-based time series forecasting to predict potential market direction. It compares current Price Action with a statistically calculated forecast value, helping traders identify possible trend continuation or reversal opportunities.
Unlike traditional indicators, the Forecast Oscillator focuses on how far price deviates from its projected regression path, making it a useful momentum and forecasting tool.
What Is the Forecast Oscillator?
The Forecast Oscillator measures the difference between:
- The current closing price
- A linear regression forecast value
This difference is expressed as a percentage, allowing traders to understand whether price is trading above or below its expected trend path.
It typically includes:
- A signal line
- An SMA (Simple Moving Average) line
- Zero line reference for trend direction
Key Features of Forecast Oscillator Indicator
- Based on linear regression forecasting model
- Measures deviation between price and predicted trend
- Works as a momentum and Trend Confirmation tool
- Includes signal line and SMA for filtering signals
- Suitable for all forex pairs and timeframes
- Helps identify overbought and oversold conditions
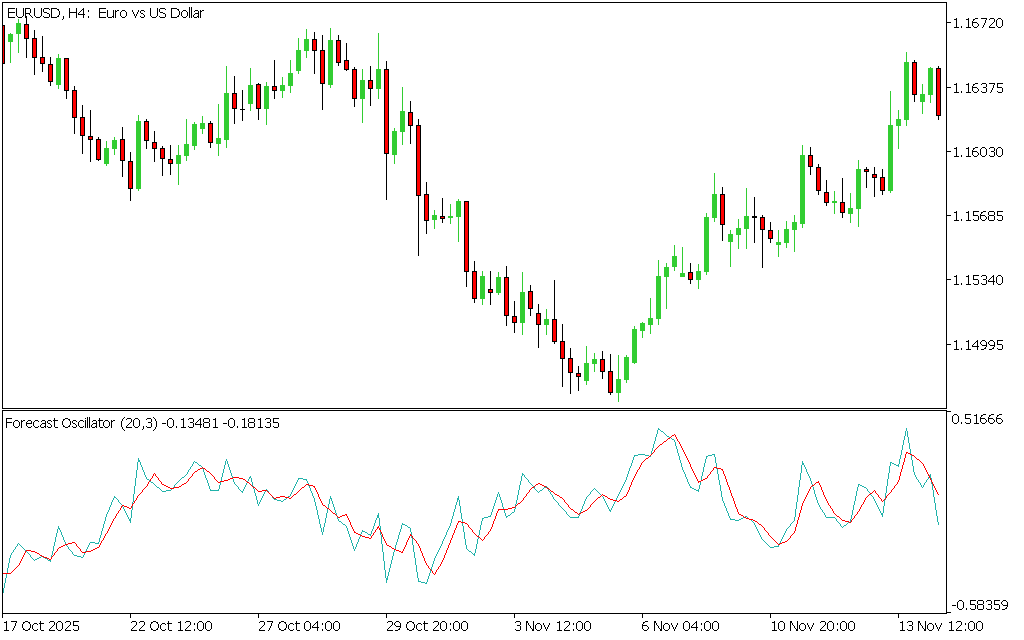
How the Forecast Oscillator Works
The indicator calculates the percentage difference between actual price and forecasted regression value:
- Above zero line → price is above forecast → bullish bias
- Below zero line → price is below forecast → bearish bias
This helps traders identify whether the market is overextended or aligned with its expected trend.
BUY and SELL Signals
Buy Signal
A BUY setup occurs when:
- The Forecast Oscillator stays above the zero line
- A blue dot appears on the chart
- Price shows upward momentum relative to regression forecast
Entry: Enter long positions after confirmation
Stop Loss: Below recent swing low or support level
Exit: When oscillator moves below zero or purple dot appears
Sell Signal
A SELL setup occurs when:
- The Forecast Oscillator stays below the zero line
- A purple dot appears on the chart
- Price shows weakness relative to forecast model
Entry: Enter short positions after confirmation
Stop Loss: Above recent swing high or resistance level
Exit: When oscillator crosses above zero or blue dot appears
How to Use Forecast Oscillator Effectively
For better accuracy:
- Trade in direction of the zero-line trend
- Avoid trading during sideways consolidation
- Use candlestick confirmation before entry
- Combine with support and resistance levels
- Use higher timeframes for stronger signals
Best Timeframes
The Forecast Oscillator performs well on:
- M15 and H1 for intraday trading
- H4 for swing trading
- Daily charts for long-term trend forecasting
Higher timeframes generally produce more reliable signals.
Recommended Indicator Combinations
To improve performance, combine with:
- Moving Averages (trend direction)
- RSI (momentum confirmation)
- MACD (Trend Strength and divergence)
- Support & Resistance zones
Conclusion
The Forecast Oscillator Indicator for MT5 is a powerful regression-based tool that helps traders anticipate market direction by comparing price with a statistically derived forecast trend. It provides clear buy and sell signals using zero-line behavior and signal dots.
When combined with proper risk management and confirmation tools, it can enhance trading accuracy and improve decision-making in both trending and ranging markets.
4 Downloads
Published:
Apr 13, 2026 08:39 AM
Category: