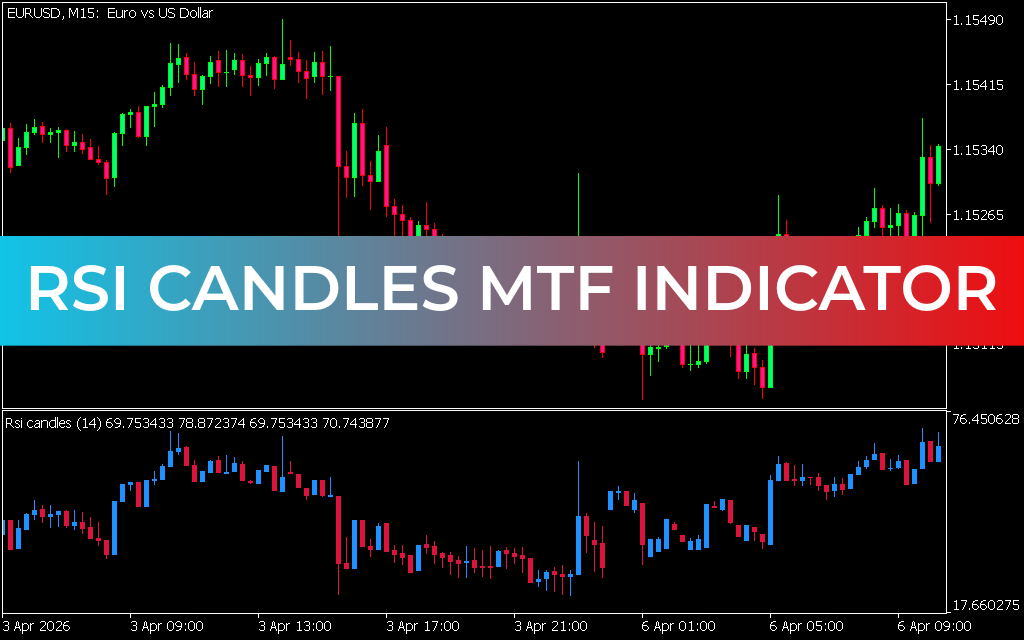
The RSI Candles Mtf Indicator for MT5 is a powerful technical analysis tool that overlays the Relative Strength Index (RSI) values directly onto candlesticks. This innovative approach helps traders quickly identify overbought and oversold zones across multiple timeframes while keeping charts clean and uncluttered.
What is the RSI Candles MTF Indicator?
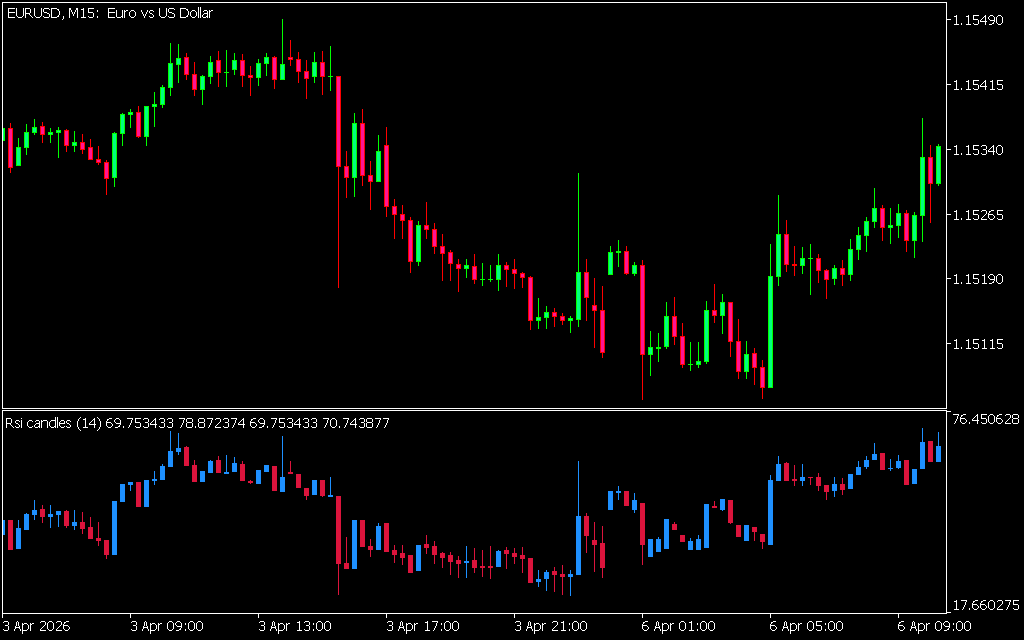
The RSI (Relative Strength Index) is a momentum oscillator that measures the speed and change of price movements. The RSI Candles MTF Indicator enhances this by painting candlesticks based on RSI values:
- Blue candles appear when RSI rises above the 50 level, suggesting bullish momentum.
- Red candles appear when RSI falls below the 50 level, signaling bearish sentiment.
This visual representation allows traders to instantly gauge market conditions without adding extra indicators to the chart.
How to Trade with RSI Candles MTF
- Identify Candle Colors – Blue indicates bullish potential, red signals bearish pressure.
- Confirm with Price Action – Use candlestick patterns like engulfing candles for stronger signals.
- Combine with Other Indicators – RSI Candles MTF works best when paired with trendlines, moving averages, or support/resistance zones.
- Avoid Sole Reliance – Candle colors alone are not direct buy/sell signals; they should be used as part of a broader trading strategy.
For example, a sell trade may be valid when the RSI is below 50, the candle is red, and price action confirms with a bearish engulfing pattern.
Benefits of RSI Candles MTF
- Multi-Timeframe Analysis: View RSI conditions across different chart periods.
- Clutter-Free Charts: Simplifies analysis by embedding RSI directly into candles.
- Quick Decision-Making: Instantly spot momentum shifts without switching indicators.
- Free Download: Available at no cost for MetaTrader 5 users.
Conclusion
The RSI Candles MTF Indicator for MT5 is a streamlined, effective tool for traders who want to integrate RSI analysis directly into candlestick charts. By combining it with price action and other technical tools, traders can enhance their ability to identify market trends and reversals.
Published:
Apr 07, 2026 05:22 AM
Category: