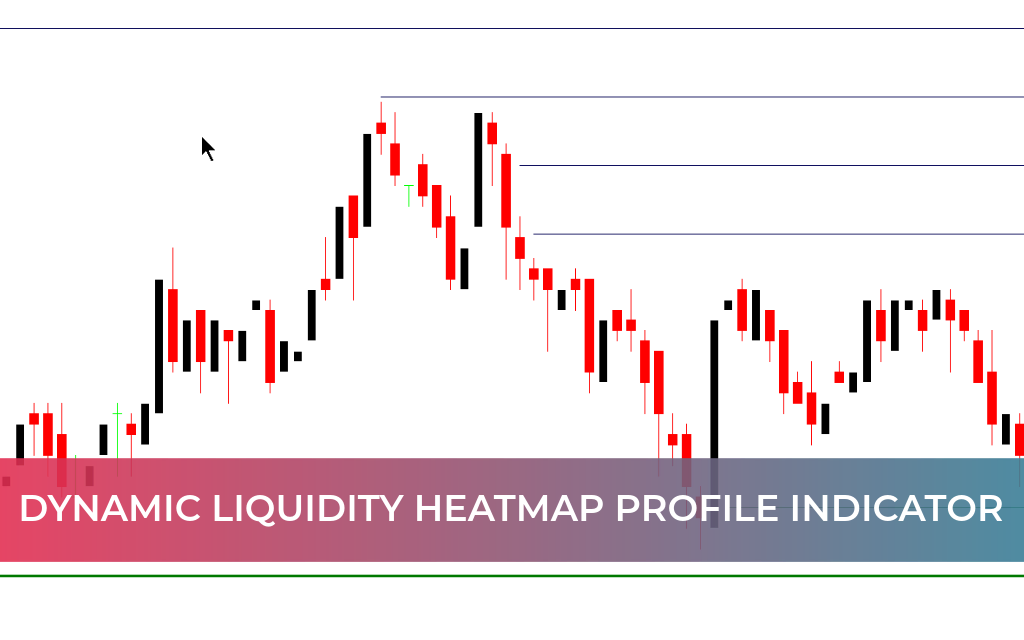
The Dynamic Liquidity HeatMap Profile Indicator for MT4 is an advanced market analysis tool designed to visualize liquidity concentration across different price levels. Instead of tracking large institutional positioning directly, this indicator maps Liquidity Zones using a heatmap-style horizontal profile, helping traders better understand where price is likely to react.
For traders focused on Market Structure, liquidity behavior, and reaction zones, this tool provides valuable context—especially during consolidation phases or before strong impulsive movements.
Advanced Liquidity Visualization
The indicator analyzes historical price data over a specified number of bars and builds a horizontal liquidity profile directly on the chart. This allows traders to clearly see:
High-liquidity clusters
Low-liquidity gaps
Maximum liquidity points
Potential reaction zones
Strong liquidity areas often act as magnets for price. In many cases, price gravitates toward these zones before reacting, consolidating, or breaking through.
This makes the indicator particularly effective for both intraday and swing traders who rely on structure and context rather than simple signal-based entries.
How the Dynamic Liquidity HeatMap Works
Unlike traditional indicators, this tool does not generate arrow-based buy or sell signals. Instead, it delivers contextual information that enhances trade decision-making.
When price approaches a dense liquidity zone:
Sharp rejection often signals strong defense from market participants.
Slow absorption followed by continuation may indicate a breakout scenario.
High-liquidity zones above current price frequently behave as resistance, while those below act as support. The highlighted maximum liquidity level is especially important, as price tends to revisit this point multiple times.
By combining liquidity zones with:
Price action analysis
Market structure
Session timing
Trend direction
traders can significantly improve trade timing and risk management.
Ideal for Structure-Based Trading
The Dynamic Liquidity HeatMap Profile Indicator is best suited for traders who:
Focus on liquidity and order flow concepts
Trade breakouts or reversals
Analyze consolidation zones
Prefer contextual tools over signal-based systems
It performs particularly well in volatile markets and range-bound conditions, where understanding liquidity distribution provides a strategic edge.
Conclusion
The Dynamic Liquidity HeatMap Profile Indicator for MT4 is a powerful decision-support tool for traders who prioritize liquidity analysis and market structure. Rather than telling you exactly when to enter, it highlights where price is most likely to react.
When combined with strong price action strategies and disciplined risk management, this indicator can significantly improve trade quality, accuracy, and confidence.
FAQ
11 Downloads
Published:
Feb 21, 2026 11:38 AM
Category: