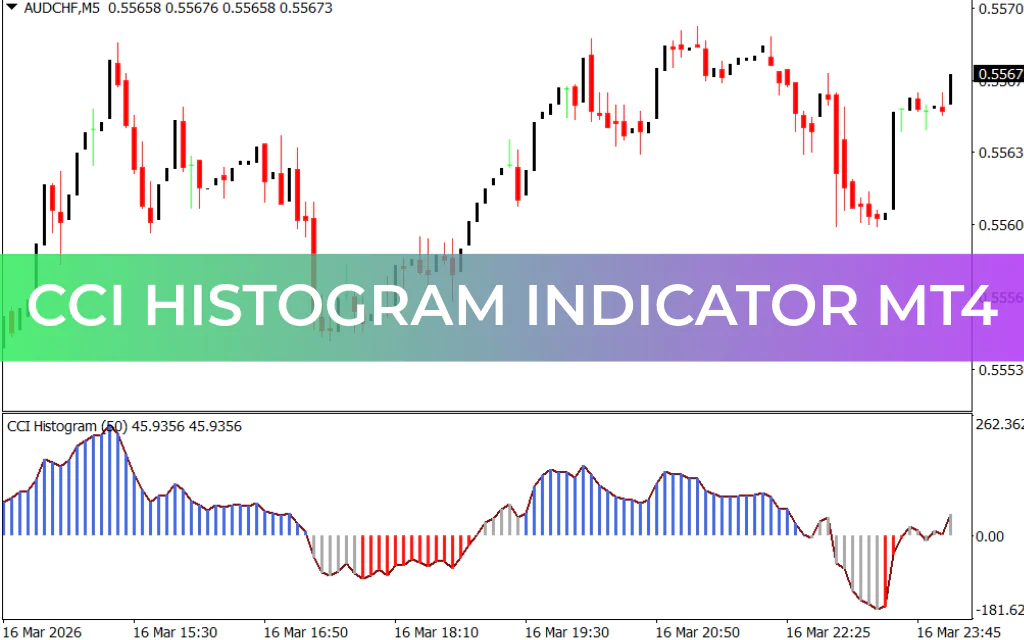
The CCI Histogram Indicator is a powerful trading tool based on the Woodies Commodity Channel Index (Woodies CCI). It is designed to visually display three distinct market conditions—BULLISH, BEARISH, and FLAT—in an easy-to-read histogram format. As a non-repaint MT4 indicator, traders can trust its signals for both intraday and long-term strategies.
How the CCI Histogram Works
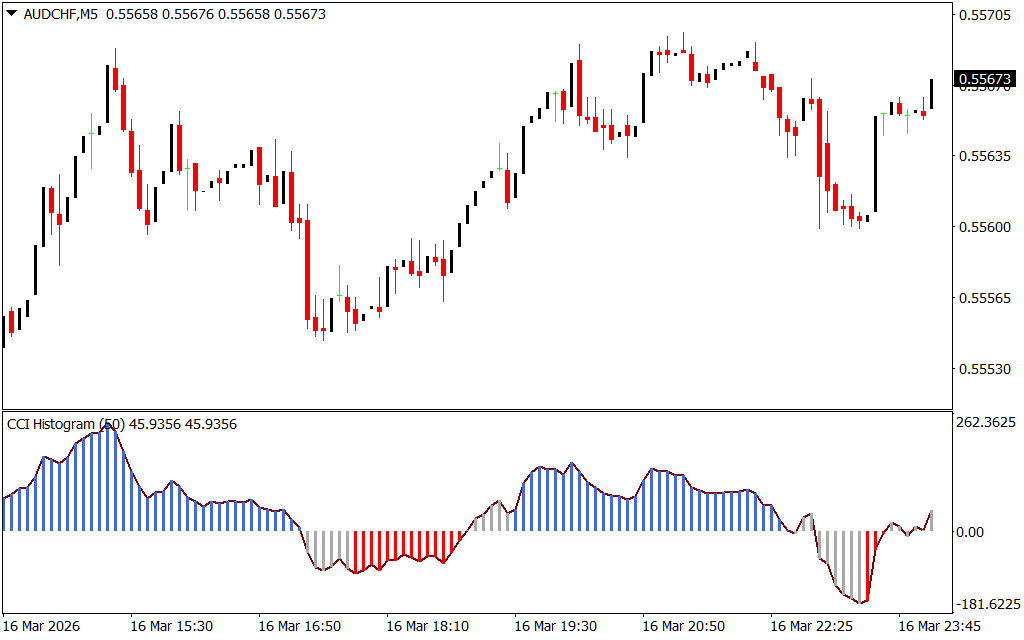
- Histogram Colors:
- Blue → BULLISH trend
- Red → BEARISH trend
- Dark Gray → FLAT or weak trend
- The indicator allows traders to enter and exit trades based on trend changes and confirms Trend Strength.
- Applicable to any timeframe and suitable for all types of trend-following strategies.
Trading Signals with CCI Histogram
Buy Signal:
- Histogram turns Blue, indicating a bullish trend.
- Enter a BUY position.
- Place stop-loss below the previous swing low.
- Exit when the histogram turns Dark Gray (FLAT trend) or based on your trading strategy.
Sell Signal:
- Histogram turns Red, indicating a bearish trend.
- Enter a SELL position.
- Place stop-loss above the previous swing high.
- Exit when the histogram turns Dark Gray (FLAT trend).
Aggressive Trading Option:
- Ignore the FLAT trend signals.
- Enter trades immediately when the histogram switches from Blue to Red or Red to Blue.
For best results, combine histogram signals with Support And Resistance zones, trendlines, or price channels.
Key Benefits
- Non-Repaint Indicator: Signals remain reliable and do not change after the fact.
- Visual Clarity: Easily identifies bullish, bearish, and flat conditions.
- Versatile: Works on all timeframes for Scalping, intraday, or long-term trading.
- Integration: Compatible with other technical strategies like breakout trading, trendline analysis, or automated trading systems.
- Beginner-Friendly: Simple color-coded signals make it easy for new traders to follow trends.
Conclusion
The CCI Histogram Indicator for MT4 is an ideal tool for trend-following traders. It not only highlights bullish and bearish trends but also identifies flat market conditions, which helps traders avoid weak trends. The BUY, SELL, and exit signals are clear and visually intuitive, enhancing trading efficiency.
The indicator is free to download and install, making it a practical addition for both new and experienced traders seeking a reliable trend-following solution.
FAQ
Published:
Mar 16, 2026 19:09 PM
Category: