MetaTrader 4 (MT4) provides the MQL4 programming language, enabling traders to create custom indicators for analyzing bullish and bearish markets. One powerful tool available is the Murrey Math Time Frame Indicator for MT4, designed to identify key Support And Resistance levels and guide traders on market trends and reversals.
What is the Murrey Math Time Frame Indicator?
Based on the mathematical principles of Murrey Math, which are derived from W.D. Gann’s geometric theory, this indicator divides market movements into eight equal increments (octaves) to identify potential reversal and continuation points. These levels allow traders to time entries and exits with precision, based on calculated retracements from 0/8 to 8/8.
How It Works
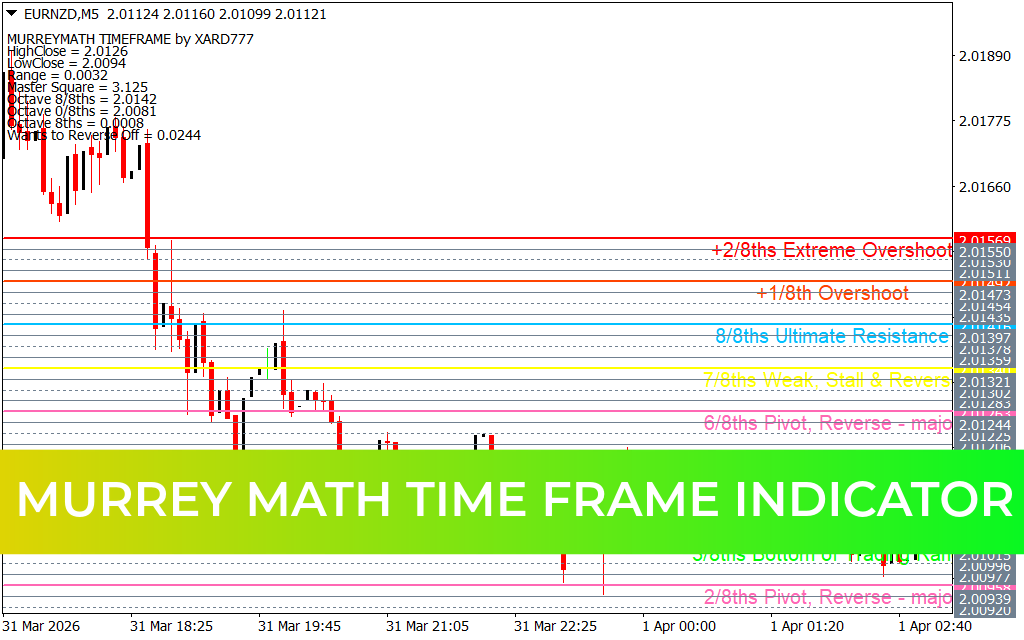
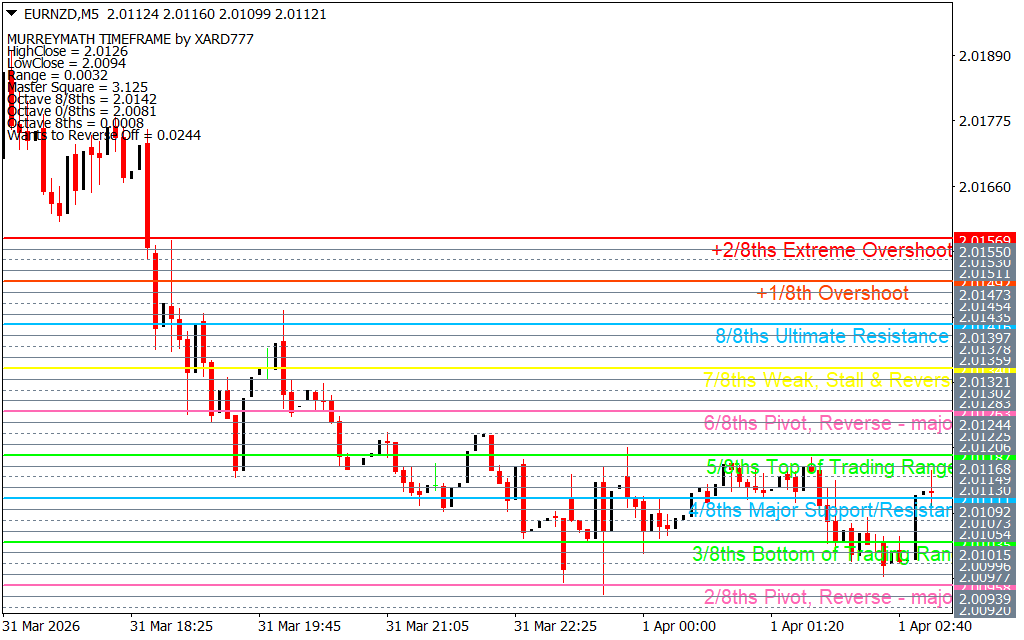
The Murrey Math Time Frame indicator plots horizontal pivot lines on your chart, each representing critical support and resistance levels. The chart is divided into increments of 1/8, creating nine primary pivot points, plus additional lines for overbought and oversold conditions.
Key Pivot Points:
- +2/8 – Extreme Overshoot
- +1/8 – Overshoot
- 8/8 – Ultimate Resistance
- 7/8 – Weak, Stall & Reverse
- 6/8 – Pivot, Reverse – Major
- 5/8 – Top of Trading Range
- 4/8 – Major Support/Resistance
- 3/8 – Bottom of Trading Range
- 2/8 – Pivot, Reverse – Major
- 1/8 – Weak, Stall & Reverse
- 0/8 – Ultimate Support
- -1/8 – Overshoot
- -2/8 – Extreme Overshoot
Trading Signals
Buy / Bullish Signals:
- If the price is near 0/8 to -2/8, the market is oversold, signaling a potential upward reversal. Traders can enter buy positions using the 0/8 level or confirm the reversal with other indicators or support levels.
Sell / Bearish Signals:
- If the price is near 8/8 to +2/8, the market is overbought, indicating a potential downward reversal. Traders can enter sell positions at the 8/8 level or confirm using additional resistance levels or technical indicators.
How to Use
The Murrey Math Time Frame indicator works across multiple timeframes, including daily, weekly, and monthly charts, and can be combined with other technical indicators for more accurate entries and exits. By understanding the meaning of each pivot point, traders can identify trends, anticipate reversals, and set strategic stop loss and take profit levels.
Conclusion
The Murrey Math Time Frame Indicator for MT4 is a versatile tool for traders seeking structured support and resistance levels based on mathematical principles. By dividing market movement into octaves, it helps time entries and exits, making it a valuable addition to any trading strategy.
2 Downloads
Published:
Mar 31, 2026 21:02 PM
Category: