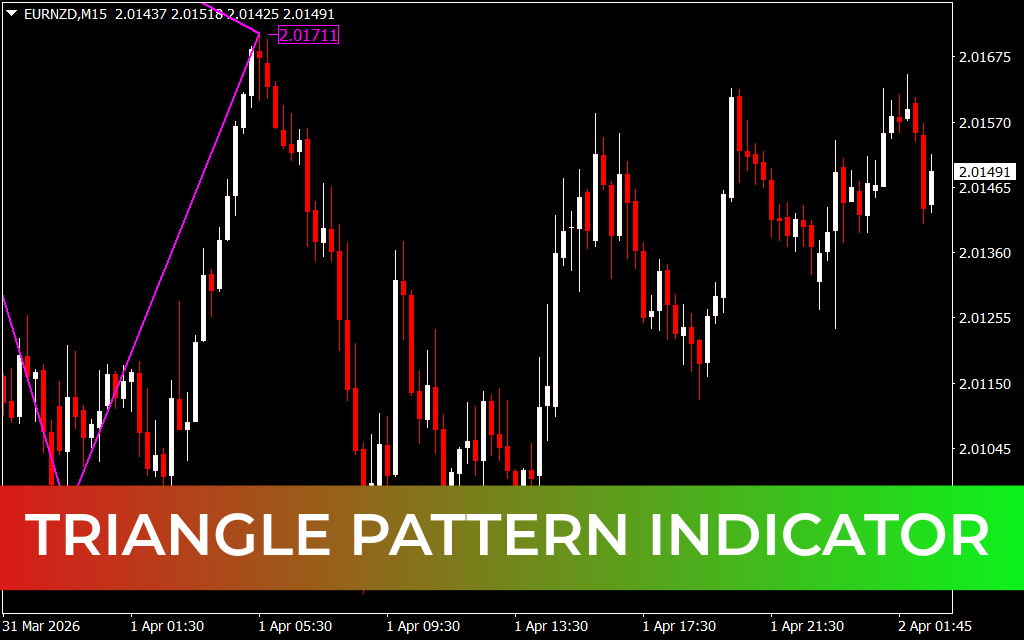
The Triangle Pattern Indicator for MT4 is a powerful tool designed to automatically detect and draw one of the most reliable chart patterns in forex trading—the triangle pattern. These patterns are widely used by traders to identify trend continuation opportunities and potential breakout points.
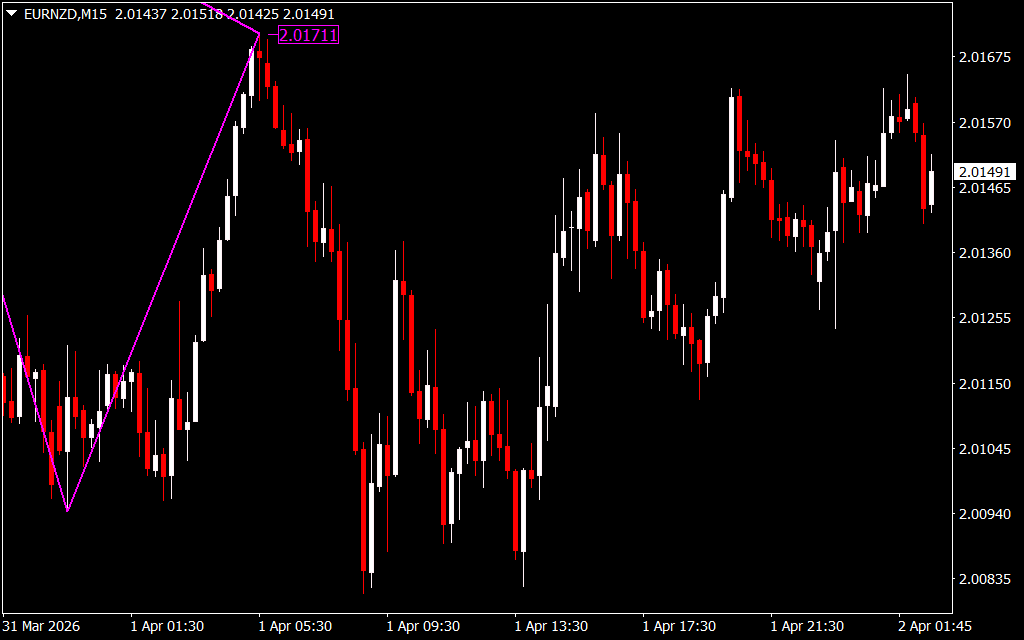
By connecting key highs and lows, the indicator plots triangle formations directly on your chart, helping you spot trading opportunities without manual analysis.
What Is the Triangle Pattern Indicator?
The Triangle Pattern Indicator automatically identifies and draws triangle formations using trendlines:
- Upper trendline connects swing highs
- Lower trendline connects swing lows
These formations signal price consolidation before a potential breakout, usually in the direction of the prevailing trend.
Types of Triangle Patterns
The indicator detects all three major triangle patterns:
1. Ascending Triangle
- Flat resistance with rising support
- Bullish continuation pattern
- Higher probability of upward breakout
2. Descending Triangle
- Flat support with falling resistance
- Bearish continuation pattern
- Higher probability of downward breakout
3. Symmetrical Triangle
- Converging trendlines
- Neutral pattern
- Breakout can occur in either direction
Understanding these patterns is essential before taking trades based on the indicator.
How to Use the Triangle Pattern Indicator
Step 1: Identify the Pattern
When the indicator plots a triangle, it signals a potential continuation setup.
Step 2: Wait for Breakout Confirmation
- Look for a strong candle close outside the triangle
- Avoid entering trades prematurely
- Confirm direction with momentum
Step 3: Enter the Trade
- Enter in the direction of the breakout
- Prefer trading during high-liquidity sessions for better reliability
Step 4: Optional Retest Entry
- Wait for price to retest the breakout level
- Enter after confirmation for safer trades
Trading Tips for Better Accuracy
- Use higher timeframes (H1, H4, Daily) for more reliable signals
- Combine with indicators like Moving Average or MACD for confirmation
- Ascending and descending triangles are generally easier for beginners
- Symmetrical triangles require patience and confirmation
Indicator Compatibility
This indicator works well alongside other pattern-based tools such as:
- ZP Three Drives Patterns Indicator
- Harmonic Pattern Indicator
Combining multiple pattern tools helps identify more advanced market structures and improves overall trading accuracy.
Pros and Cons
✅ Pros
- Automatically detects triangle patterns
- Eliminates manual trendline drawing
- Works best in trending markets
- Beginner-friendly and easy to use
- Helps align trades with trend direction
❌ Cons
- Less effective in sideways markets
- False breakouts on lower timeframes
- Requires confirmation from other indicators
Best Timeframes for Trading
For optimal performance, use the indicator on:
- H1 (1-hour)
- H4 (4-hour)
- Daily charts
Higher timeframes reduce noise and improve breakout reliability.
Conclusion
The Triangle Pattern Indicator for MT4 is an essential tool for traders who want to capitalize on trend continuation patterns. By automatically identifying triangle formations, it simplifies technical analysis and helps traders focus on high-probability breakout setups.
For best results, combine it with momentum indicators and wait for strong breakout confirmation before entering trades.
Published:
Apr 01, 2026 20:58 PM
Category: