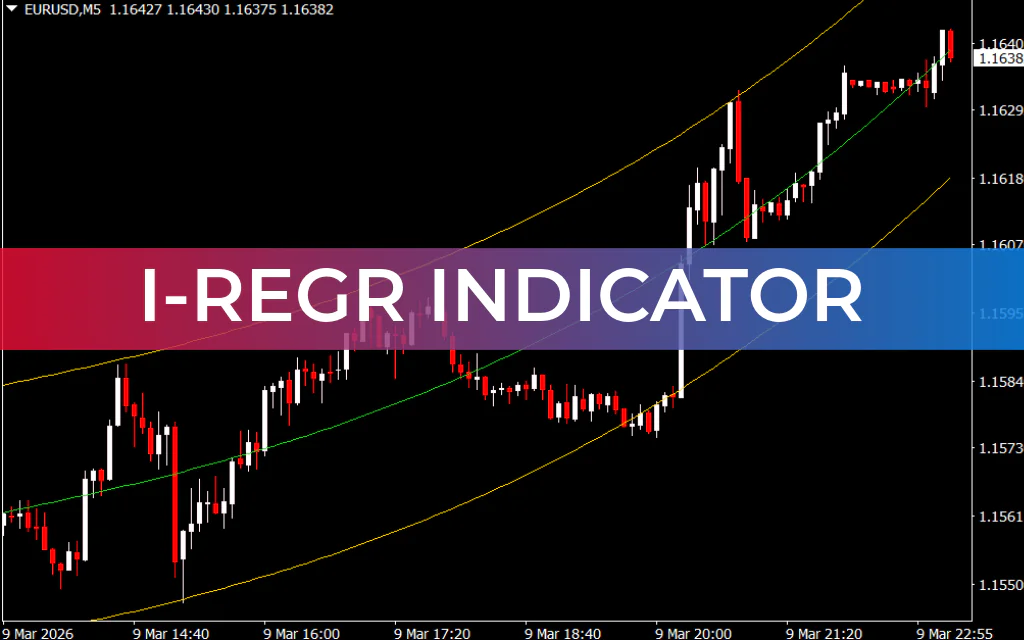
The i-Regr Indicator for MT4 is a powerful parallel channel indicator designed to help forex traders identify trend direction and potential price reversal zones. Built on the linear regression principle, this indicator analyzes historical price data to determine the probable high and low boundaries of price movement.
By automatically plotting equidistant parallel lines, the indicator forms a dynamic price channel that can act as Support And Resistance levels. These levels often represent high-probability BUY and SELL zones, allowing traders to make better entry and exit decisions.
Because of its ability to highlight both trend direction and reversal areas, the i-Regr Indicator is widely used by trend traders and counter-trend traders.
What Is the i-Regr Indicator?
The i-Regr Indicator uses linear regression algorithms to detect the most probable price path of an asset. It then draws parallel lines around the Price Action, forming a channel that reflects the natural movement of the market.
This price channel helps traders visualize:
- Trend direction
- Potential reversal zones
- Dynamic support and resistance levels
When the price approaches the upper or lower boundary of the channel, it often signals a possible trend continuation or reversal.
Key Features of the i-Regr Indicator
The i-Regr Indicator offers several advantages for forex traders:
- Automatically draws linear regression price channels
- Highlights potential reversal zones
- Identifies short-term and long-term trends
- Provides clear visual support and resistance levels
- Suitable for all experience levels
The indicator is chart-friendly and easy to understand, making it a great choice for both beginners and professional traders.
Compatible Trading Styles
The i-Regr Indicator is flexible and works well across multiple trading strategies, including:
- Scalping
- Intraday/Day trading
- Swing trading
Because the indicator adapts to different timeframes, it can be used in both short-term and long-term trading strategies.
How to Trade with the i-Regr Indicator
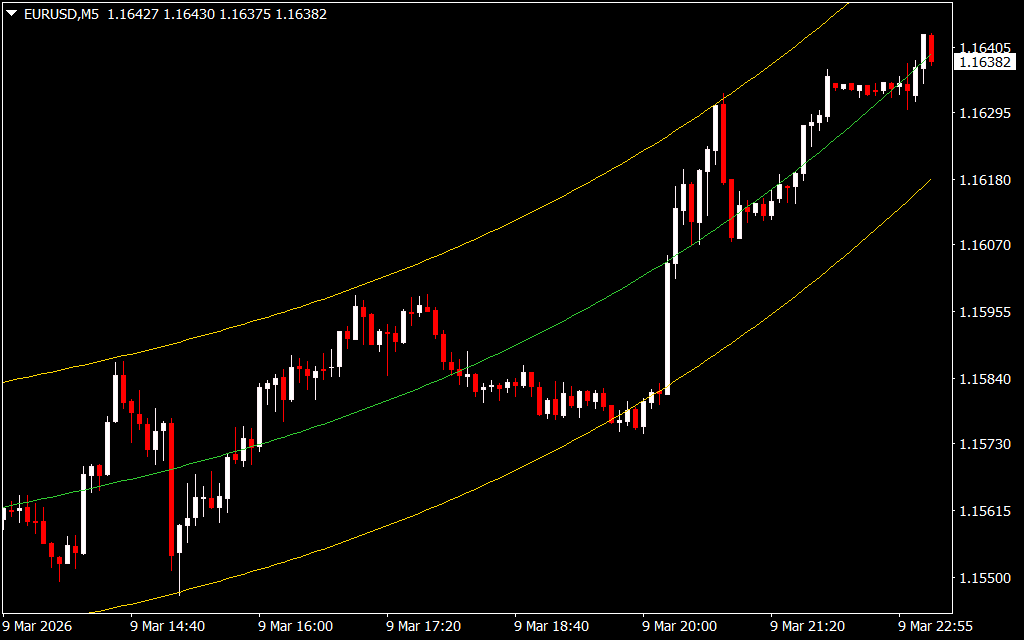
After installing the indicator on your MT4 chart, it will automatically draw equidistant parallel channel lines that represent potential price boundaries.
BUY Signal
Follow these steps to identify a BUY opportunity:
- Wait for the indicator to draw the parallel price channel.
- Allow the price to touch the lower boundary (yellow line).
- Look for clear wick rejection at the lower boundary.
- Wait for a bullish candlestick confirmation.
- Enter a BUY/LONG trade after the confirmation candle closes.
This setup indicates that the price may reverse upward from channel support.
SELL Signal
To identify a SELL opportunity, apply the reverse strategy:
- Wait for the price to reach the upper boundary of the channel.
- Look for wick rejection at the resistance zone.
- Confirm the setup with a bearish candlestick.
- Enter a SELL/SHORT position after confirmation.
This suggests that the price may reverse downward from channel resistance.
Risk Management Tips
Proper risk management is essential when using any trading indicator.
Recommended practices include:
- Place Stop Loss a few pips above or below the entry zone, depending on trade direction.
- Move the trade to break-even once the price moves beyond the middle (green) line.
- Use the opposite channel boundary as a potential Take Profit target.
These strategies help traders protect profits and reduce trading risks.
Conclusion
The i-Regr Indicator for MT4 is an effective tool for traders looking to identify trends and trade price reversals with greater accuracy. By drawing linear regression channels, the indicator highlights potential support and resistance levels, making it easier to locate high-probability trade setups.
Its simple design, combined with powerful analytical capabilities, makes it suitable for scalpers, day traders, and swing traders alike.
You can download the i-Regr Indicator for MT4 for fre
FAQ
Published:
Mar 09, 2026 18:18 PM
Category: