The Bollinger Bands Stop V2 Indicator for MT4 is a powerful technical tool designed to help traders identify trend direction, entry points, and exit opportunities in the forex market. Based on the concept of Bollinger Bands, this indicator simplifies trading decisions by displaying visual signals directly on the chart.
The main purpose of the indicator is to help traders detect trend reversals and continuation signals, allowing them to determine the most favorable trading opportunities. Since identifying the right entry and exit points is essential for profitable trading, many traders use indicators like Bollinger Bands Stop V2 as part of their technical analysis.
Although the indicator is effective on its own, traders often combine it with other tools for better confirmation. A popular combination is using the indicator alongside the Relative Strength Index (RSI) to validate Trend Strength and avoid false signals.
Bollinger Bands Stop V2 Indicator Buy and Sell Signals
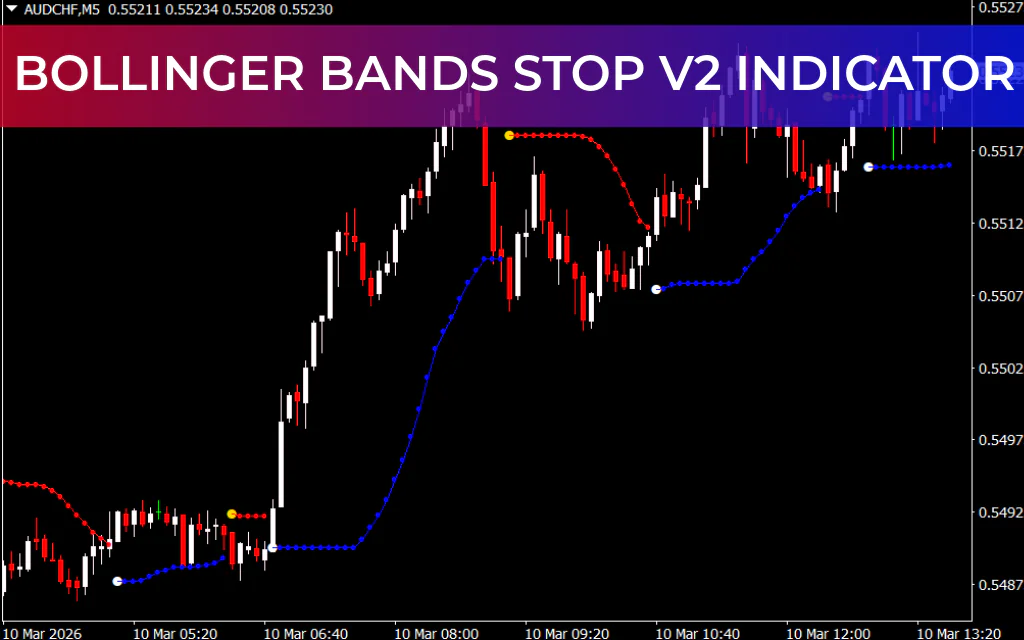
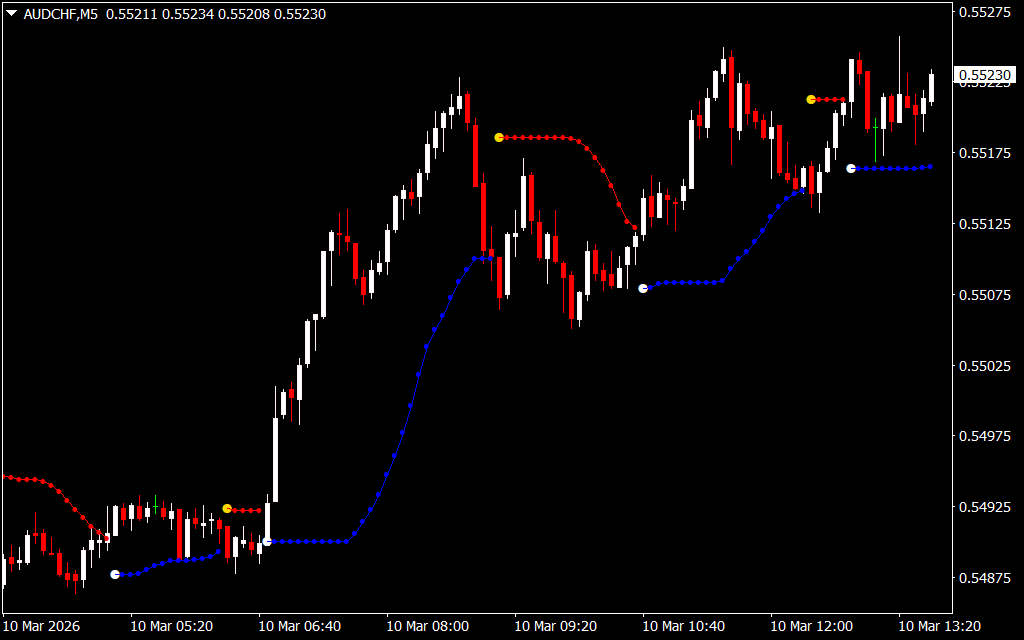
When applied to an MT4 chart, the Bollinger Bands Stop V2 Indicator plots colored dots above or below price bars. These dots represent the direction of the current market trend and provide potential buy or sell signals.
- Blue dots indicate bullish market conditions.
- Red dots indicate bearish market conditions.
These visual signals help traders quickly identify trading opportunities without needing complex chart analysis.
Buy Signal
A buy signal occurs when the indicator displays a blue dot below the price bar. This suggests that the market is entering or continuing an uptrend.
When this signal appears, traders may consider opening a long (buy) position while monitoring the trend for continuation.
Sell Signal
A sell signal appears when the indicator plots a red dot above the price bar. This indicates a downtrend and suggests that bearish momentum may continue.
At this point, traders may consider opening a short (sell) position.
Trend Strength Tip
An additional clue about trend strength comes from the distance between the dots and the candlesticks:
- Dots far from the price bars indicate a strong trend.
- Dots close to the price bars suggest a weaker trend or potential consolidation.
This simple visual cue helps traders gauge the strength of the market before entering a trade.
Combining the Indicator With Other Tools
While the Bollinger Bands Stop V2 Indicator can be used alone, combining it with other indicators can improve signal reliability. Common confirmation tools include:
- Relative Strength Index (RSI)
- Moving Averages
- Support And Resistance levels
- Price Action patterns
Using multiple confirmations helps traders reduce false signals and improve overall trading accuracy.
Conclusion
The Bollinger Bands Stop V2 Indicator for MT4 is a practical and easy-to-use trading tool that highlights potential buy and sell opportunities using colored dots around price bars. By identifying trend direction and providing visual entry signals, it helps traders make faster and more informed trading decisions.
Whether used alone or combined with other technical indicators, this tool can be a valuable addition to a forex trading strategy. Best of all, the Bollinger Bands Stop V2 Indicator is available for free download and can be easily installed on the MetaTrader 4 platform.
FAQ
Published:
Mar 10, 2026 08:45 AM
Category: