The Moving Average (MA) Indicator is one of the most widely used tools in technical analysis. It smooths out market fluctuations by calculating the average price over a selected period, helping traders identify trend direction, support/resistance levels, and potential entry points.
Whether you’re trading forex, stocks, or indices, this indicator provides a clear visual representation of market momentum, making it a must-have for both beginners and advanced traders.
What Is the Moving Average Indicator?
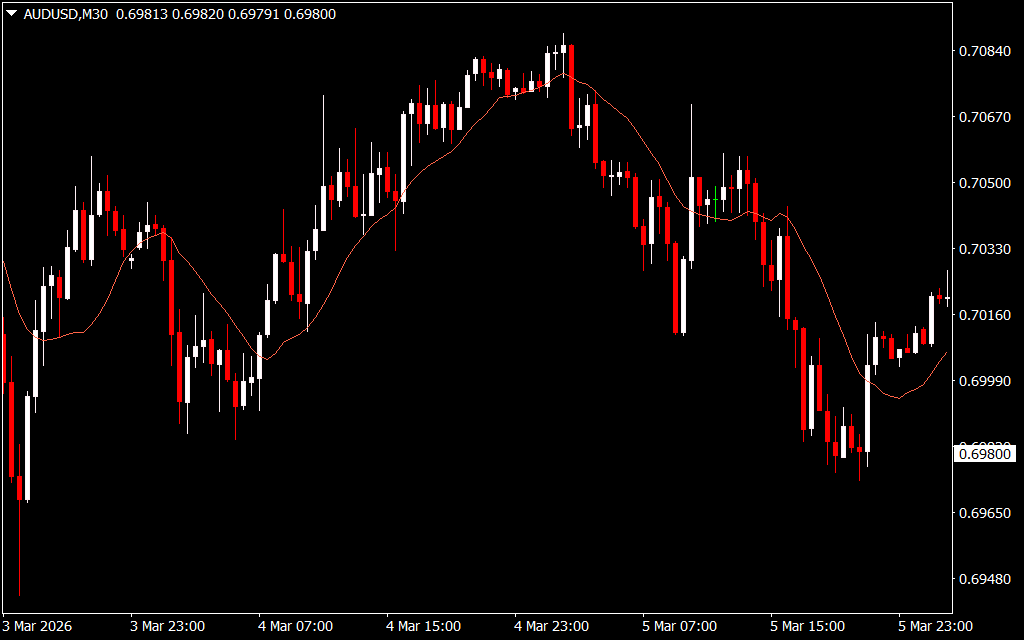
The Moving Average calculates an average price over a set period and plots it as a line on the chart. By comparing the current price to the MA line, traders can determine the market trend:
- Price above the MA line → Bullish trend
- Price below the MA line → Bearish trend
Unlike simple or exponential moving averages that may lag or react too quickly, this advanced MA indicator is designed to adapt to multiple timeframes and trading styles, giving traders a more reliable trend overview.
Benefits of Using the Moving Average Indicator
The Moving Average provides multiple advantages:
- Trend identification – Quickly spot whether the market is bullish or bearish
- Dynamic support/resistance – Acts as a trendline where price often reacts
- Ease of use – Beginner-friendly with simple visualization
- Versatility – Works on all markets and timeframes
- Customizable – Adjustable parameters to match your trading style
It’s also compatible with other moving-average-based tools, such as the Hull Moving Average Arrows Indicator for faster trend reaction and the Multi Moving Average Indicator for comparing multiple averages simultaneously.
How to Determine Buy/Sell Signals
Bullish Setup (Buy)
A buy signal occurs when the price moves above the moving average line.
Trading approach:
- Wait for the price to return to the MA line after a bullish breakout.
- Enter a long position as the price rejects the MA line and resumes upward movement.
- Use the MA line as dynamic support.
- Set stop-loss below the previous swing low and consider taking profits near resistance or counter-trend signals.
Bearish Setup (Sell)
A sell signal occurs when the price moves below the moving average line.
Trading approach:
- Wait for the price to pull back to the MA line, which now acts as resistance.
- Enter a short position when the price resumes downward momentum.
- Place stop-loss above the previous swing high.
- Take profit at support levels or upon receiving counter-trend signals.
Pros and Cons of the Moving Average Indicator
✅ Pros
- Simple and clear visualization of trends
- Works across all instruments and timeframes
- Acts as dynamic support/resistance
- Beginner-friendly yet useful for advanced traders
❌ Cons
- Lagging nature during sudden reversals
- Can produce false signals in sideways markets
- Requires confirmation from Price Action or other indicators in choppy conditions
Best Practices
- Combine the MA with momentum or volume indicators to filter false signals.
- Use on multiple timeframes for Trend Confirmation.
- Monitor price reactions near the MA line for high-probability entries.
This indicator is suitable for Scalping, intraday, swing, or long-term strategies, making it one of the most versatile tools for any trader.
Final Thoughts
The Moving Average Indicator for MT4 is a simple yet highly effective tool for detecting market trends, entry/exit points, and dynamic support/resistance zones. It is non-repainting, easy to install, and works across forex, stocks, and indices.
If you’re looking for a reliable starting point for trend analysis, this MA indicator can help you filter market noise, follow price momentum, and make better-informed trading decisions.
FAQ
Published:
Mar 15, 2026 10:58 AM
Category: