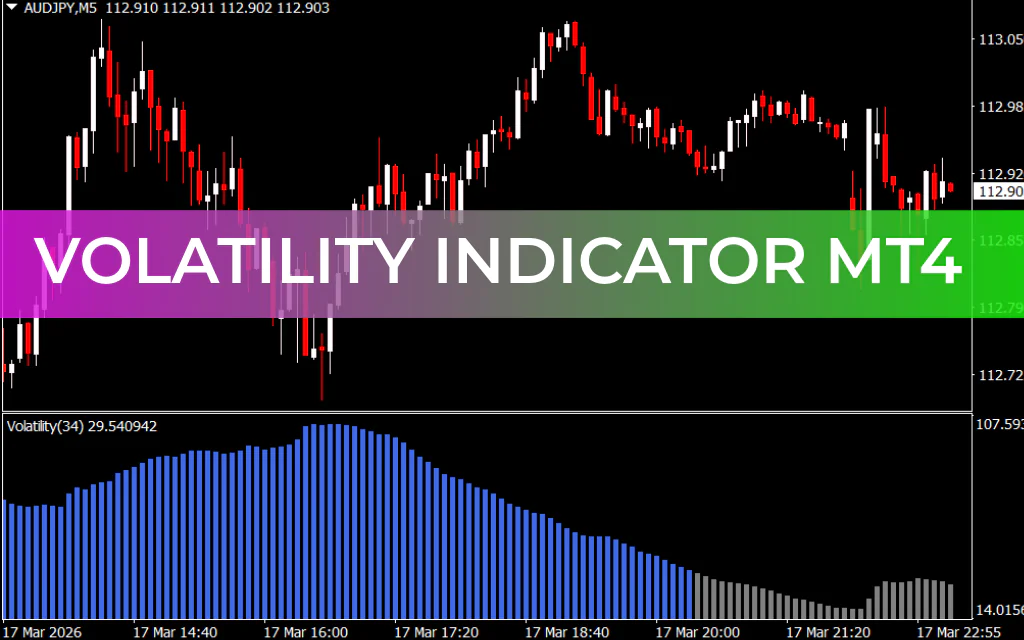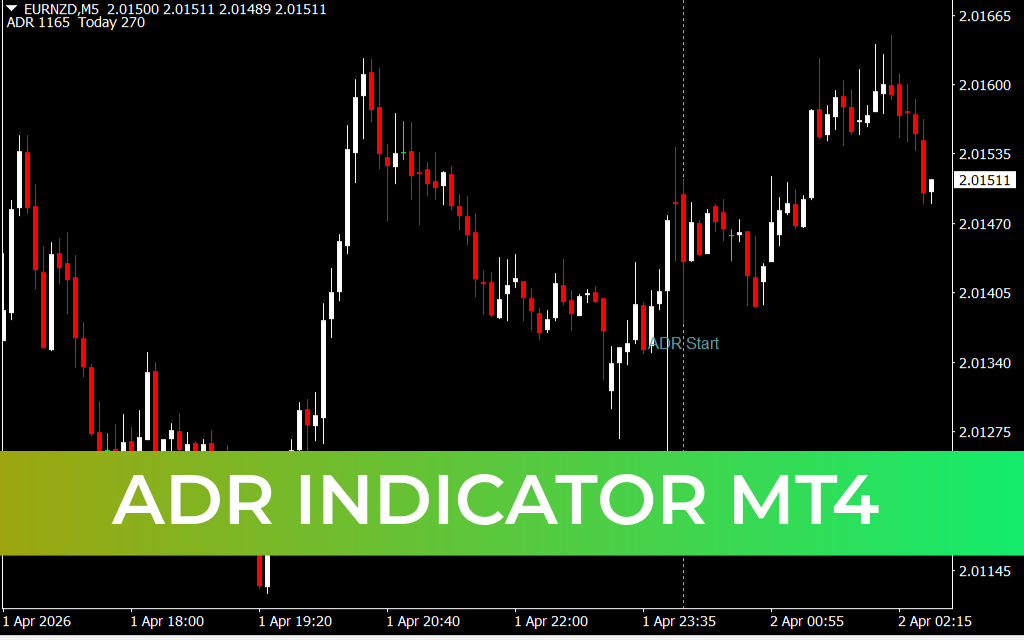
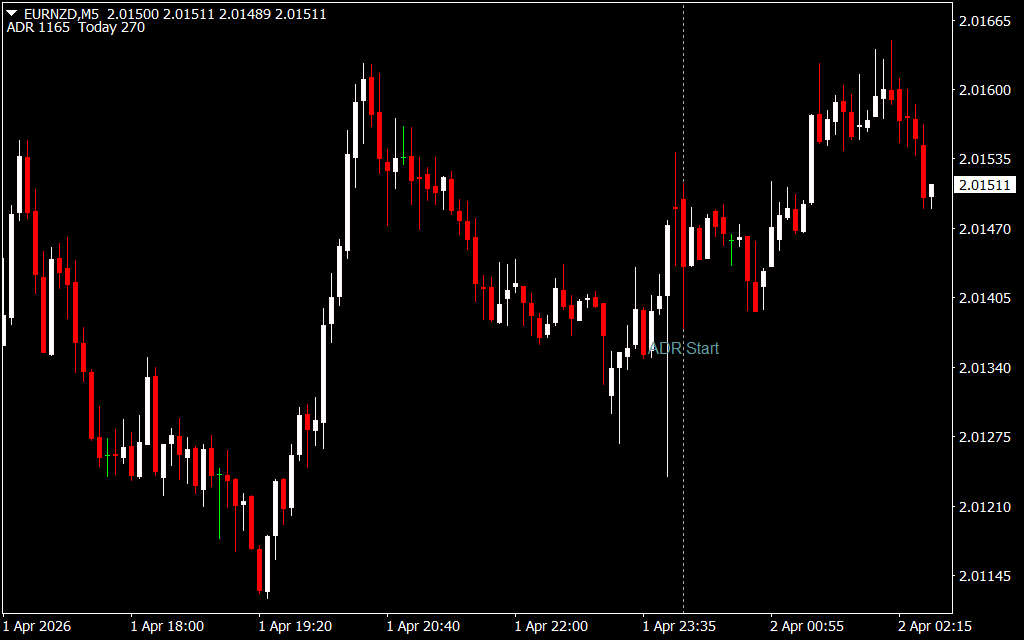
The ADR Indicator for MT4 (Average Daily Range) is a powerful technical tool that helps traders measure the expected price movement of a currency pair within a single trading day. By displaying both the historical ADR range and the current day’s range, this indicator provides valuable insight into market volatility, potential reversals, and breakout opportunities.
Whether you're a beginner or an experienced trader, the ADR Indicator can significantly improve your decision-making by highlighting key price levels where market reactions are likely to occur.
What is the ADR Indicator?
The Average Daily Range (ADR) represents the average distance between the daily high and low prices over a selected period. This indicator uses data derived from the Average True Range (ATR) to calculate expected price movement.
On your MT4 chart, the ADR Indicator:
- Displays ADR values in real time
- Shows the current day’s price range
- Plots upper and lower ADR levels as dynamic Support And Resistance
These levels act as boundaries where price is statistically likely to react.
Key Features of ADR Indicator for MT4
- Displays daily range and ADR values clearly on the chart
- Plots upper and lower ADR levels for easy analysis
- Helps identify potential breakout and reversal zones
- Based on ATR calculations for accurate volatility tracking
- Works on all currency pairs and timeframes
- Free to download and easy to install
How the ADR Indicator Works
The indicator calculates ADR using ATR data over a selected period. This period plays a crucial role:
- Lower ATR period → More sensitive, smaller ADR range
- Higher ATR period → Smoother, broader ADR range
Since each currency pair has different volatility characteristics, adjusting the ATR period allows traders to customize the indicator to their strategy.
Trading Strategies Using ADR Indicator
1. Breakout Strategy
The ADR helps traders identify when price is exceeding its typical daily range.
- Enter a BUY trade when price breaks above the upper ADR level with strong momentum
- Enter a SELL trade when price breaks below the lower ADR level
- Use volume and momentum indicators to confirm the breakout
This strategy works best during high-volatility market sessions.
2. Reversal Strategy
ADR levels often act as strong support and resistance zones.
- BUY near the lower ADR level when bullish reversal signals appear
- SELL near the upper ADR level when bearish reversal signals form
- Place stop loss beyond recent swing highs/lows
- Target the opposite ADR level for take profit
3. Intraday Support and Resistance
ADR levels are highly effective in intraday trading:
- Upper ADR level = resistance
- Lower ADR level = support
Price Action near these zones provides critical clues about market direction.
Why Traders Use the ADR Indicator
- Helps identify overbought and oversold conditions
- Improves trade timing and risk management
- Works well with price action strategies
- Complements other technical indicators
- Suitable for Scalping, day trading, and swing trading
Best Practices
- Combine ADR with price action or trend indicators
- Adjust ATR settings based on currency pair volatility
- Avoid trading blindly at ADR levels—wait for confirmation
- Backtest different settings to optimize performance
Conclusion
The ADR Indicator for MT4 is a versatile and reliable tool for identifying key trading levels and understanding daily market behavior. By using ADR in combination with price action and other indicators, traders can effectively spot high-probability breakout and reversal setups.
Its simplicity, flexibility, and effectiveness make it a must-have tool for both beginner and advanced forex traders.
1 Download
Published:
Apr 01, 2026 20:39 PM
Category: