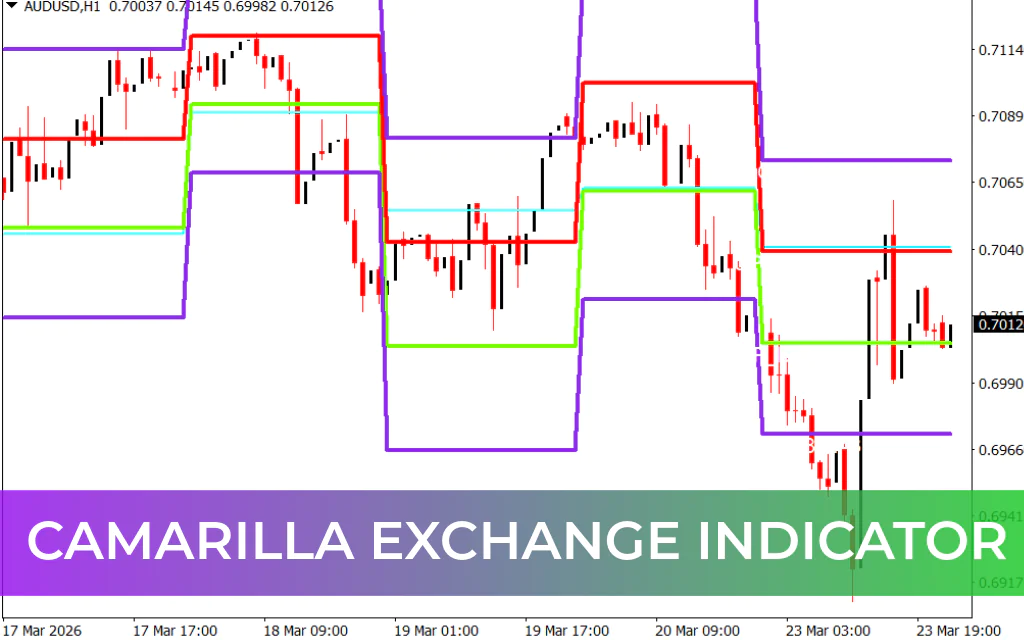
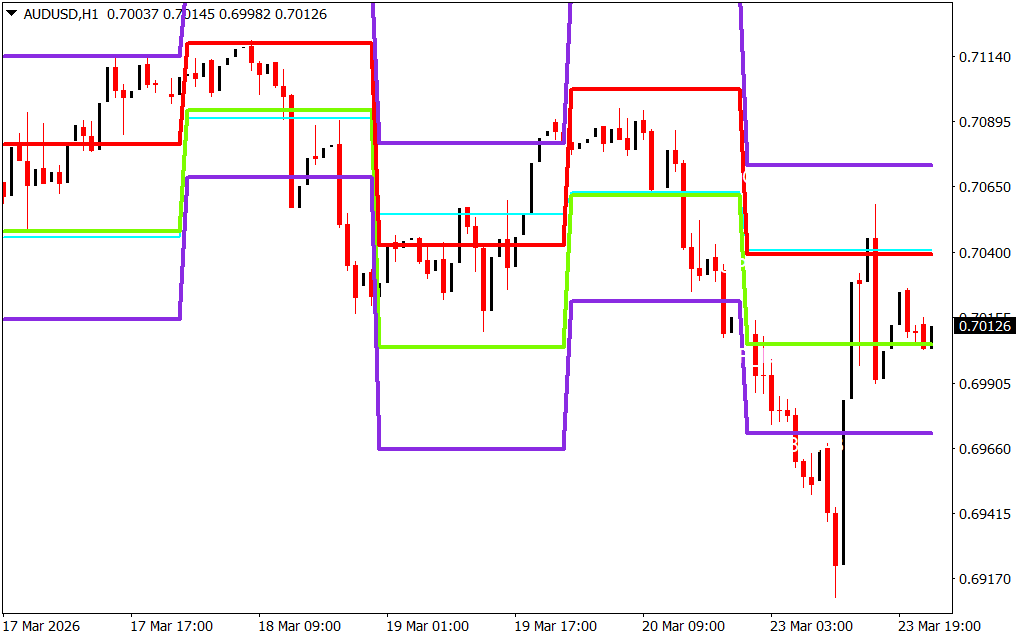
The Camarilla Exchange Indicator for MetaTrader 4 (MT4) is a versatile price-level indicator designed to help traders identify overbought and oversold conditions, intraday Support And Resistance, and critical breakout zones. While it does not provide explicit buy or sell signals, it serves as a technical assistant, helping traders decide optimal entry and exit points across all timeframes.
This tool is particularly useful for forex and stock traders who rely on swing trading or intraday strategies.
Key Features of the Camarilla Exchange Indicator
- Highlights overbought and oversold levels
- Displays intraday support and resistance zones
- Marks potential price breakout levels
- Works on all MT4 timeframes and currency pairs
- Supports swing trading and trend-following strategies
- Easy-to-read chart display with color-coded levels
How the Indicator Works
The Camarilla Exchange Indicator plots five key price levels on the chart:
- Top and bottom blue lines: Overbought and oversold levels
- Red and yellow lines: Intraday support and resistance levels
- Middle blue line: Trend Reversal or potential breakout zone
Price tends to form higher highs and lower lows around these levels, providing swing traders with opportunities to buy near the bottom and sell near the top.
Trading Guidance
- Buy Opportunities: When the price rejects a move below the bottom blue line (oversold)
- Sell Opportunities: When the price fails to exceed the upper blue line (overbought)
- Trend Confirmation: The middle blue line helps identify trend direction and breakout potential
By observing price reactions at these levels, traders can align trades with market momentum and minimize risk.
Why Use the Camarilla Exchange Indicator?
- Serves as a comprehensive support/resistance tool
- Identifies potential breakout zones for trend-based trades
- Provides actionable insights without relying on direct signals
- Improves decision-making for swing and intraday trading
Conclusion
The Camarilla Exchange Indicator for MT4 is a reliable technical tool for traders looking to navigate key price levels. It highlights overbought and oversold zones, intraday support and resistance, and potential breakout levels, making it invaluable for trend-following and swing trading strategies. When used correctly, it enhances market analysis and trade timing for all types of traders.
FAQ
1 Download
Published:
Mar 23, 2026 18:42 PM
Category: