Free
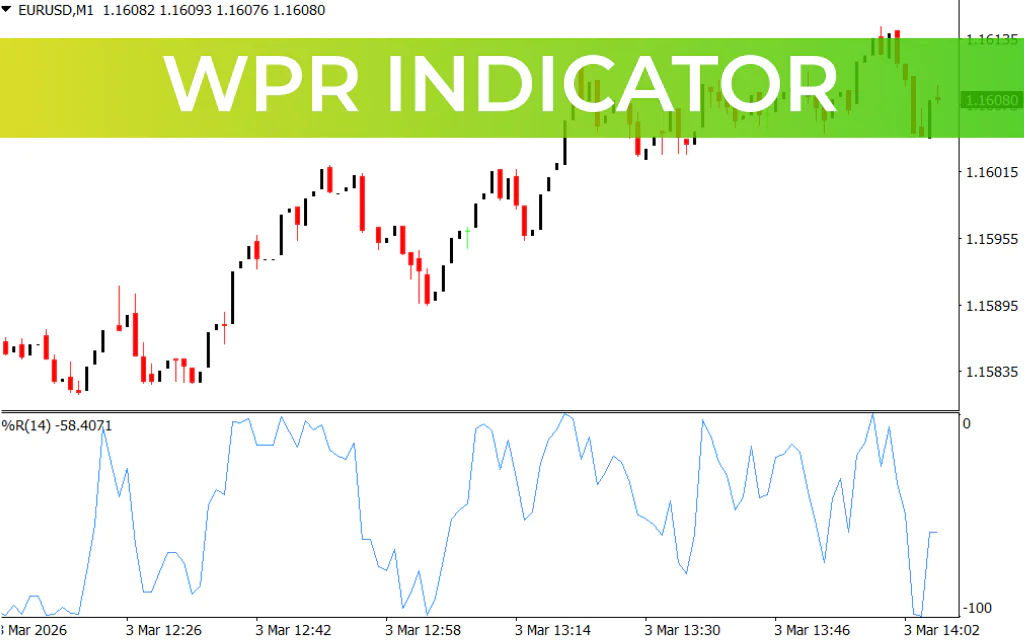
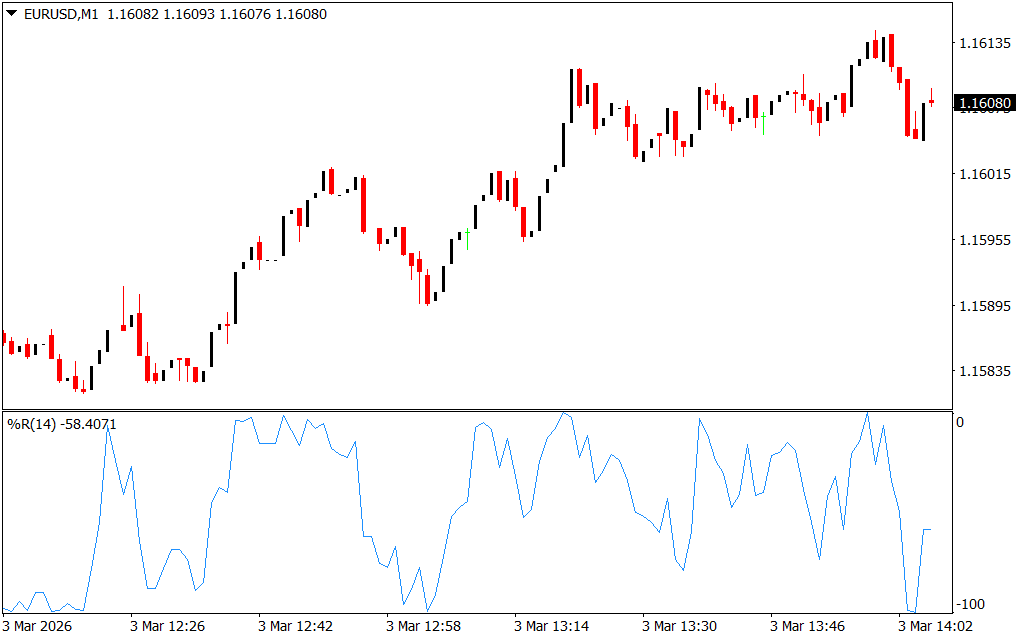
The WPR (Williams Percentage Range) Indicator for MetaTrader 4 is an oscillating tool designed to identify potential trend-reversal zones. Unlike the traditional WPR, this optimized version is more sensitive to price extremes and dynamically adapts to changing market conditions.
Key Features of the WPR Indicator
- Trend Reversal Detection: Highlights potential overbought and oversold zones to anticipate market reversals.
- Dynamic Parameters: Uses previous turning points instead of fixed overbought/oversold levels, adapting to market volatility.
- Smoothed Line: The dodger blue line tracks Price Action while reducing noise for clearer signals.
- Multi-Timeframe Compatibility: Works on intraday, daily, weekly, and monthly charts.
How to Use the WPR Indicator on MT4
- Identify Overbought/Oversold Zones:
- Observe the indicator’s line near previous turning points.
- Potential trend exhaustion is signaled when the line reverses at these zones.
- Entry Signals:
- Buy Signal: When the indicator reverses near a prior oversold zone, confirmed with bullish price action.
- Sell Signal: When the indicator reverses near a prior overbought zone, confirmed with bearish price action (e.g., bearish engulfing, rejection candles).
- Confluence with Other Indicators:
- Use alongside price action, Trend Confirmation tools, or support/resistance levels for higher probability trades.
Tips for Optimal Trading
- Focus on previous overbought/oversold zones rather than fixed levels.
- Best used on trending markets to anticipate reversals after minor retracements.
- Ideal for traders seeking a flexible, adaptive Momentum Indicator.
Conclusion
The WPR Indicator for MT4 provides flexible, dynamic insights into overbought and oversold zones, making it a reliable tool for spotting potential trend reversals. By combining WPR signals with price action and other technical indicators, traders can improve trade accuracy and timing.
FAQ
Optimized version more sensitive to price extremes. Dynamically adapts to changing conditions. Uses previous turning points instead of fixed overbought/oversold levels. Dodger blue line tracks price while reducing noise. Highlights overbought and oversold zones.
Buy: indicator reverses near prior oversold zone. Sell: indicator reverses near prior overbought zone. Potential trend exhaustion when line reverses at these zones.
Intraday, daily, weekly, monthly. MT4.
Trend-reversal traders. Those wanting dynamic parameters. MT4.
More sensitive. Dynamic parameters. Uses previous turning points.
Published:
Mar 03, 2026 08:08 AM
Category:
Share: