The Weis Volume Indicator is a popular volume-analysis tool designed for MetaTrader 4. It was developed by market analyst David Weis, who expanded on concepts from the Wyckoff Method and explained them in his book Trades About to Happen: A Wyckoff Method.
The indicator focuses on the idea that price and volume move in waves rather than in equal proportions. By analyzing these waves and the associated volume, traders can better understand trend direction, buying pressure, and selling pressure.
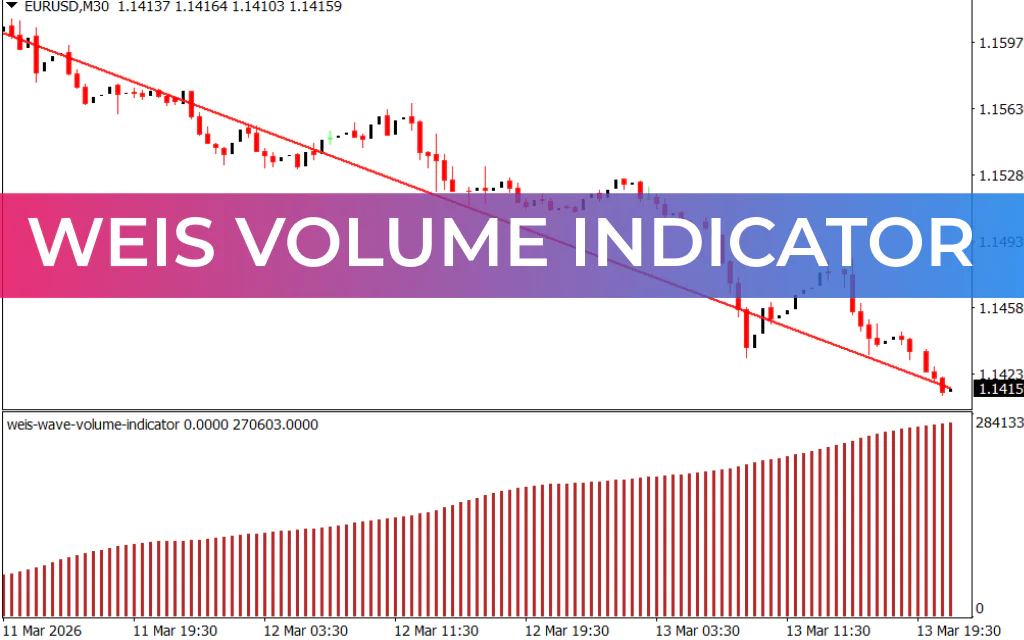
The Weis Volume Indicator displays a trend wave and a set of volume bars, helping traders quickly identify whether the market is dominated by buyers or sellers.
How the Weis Volume Indicator Works
The indicator consists of two main elements:
1. Trend Wave
The wave shows the direction of the current market trend.
- Upward wave → bullish trend
- Downward wave → bearish trend
This wave structure also helps traders identify potential entry and exit points.
2. Volume Bars
Volume bars appear at the bottom of the chart and represent the strength of market activity.
- Green bars indicate bullish pressure
- Red bars indicate bearish pressure
Each bar also displays a numeric value, showing the volume level for that price wave:
- Higher numbers = stronger market participation
- Lower numbers = weaker momentum
These numbers help traders quickly evaluate whether a trend has strong or weak support from volume.
Trading Concept Behind the Weis Indicator
The Weis Volume indicator works on the fundamental market principle of Supply And Demand.
- When buying pressure increases, the indicator forms green bars and an upward wave.
- When selling pressure dominates, it produces red bars and a downward wave.
The main rule when trading with this indicator is simple:
- High volume = potential trade opportunity
- Low volume = avoid or exit trades
Buy Strategy
Follow these steps for a buy setup:
- The indicator shows high volume activity.
- The wave begins moving upward.
- A green volume bar appears.
- Enter a buy trade.
- Place the stop-loss near the recent swing low.
- Exit the trade when the volume bar changes color.
This setup indicates strong accumulation and bullish market pressure.
Sell Strategy
Follow these steps for a sell setup:
- The indicator shows strong volume.
- The wave starts moving downward.
- A red volume bar appears.
- Enter a sell trade.
- Place the stop-loss near the recent swing high.
- Exit when the volume bar changes color.
This setup signals distribution and increasing selling pressure.
Important Trading Tip
The Weis indicator can sometimes produce false signals in low-volume conditions. To improve accuracy:
- Wait for clear volume spikes
- Enter trades only when the bar color changes
- Avoid trading during sideways markets
The wave structure also helps refine entries:
- Wave dips → potential buying opportunity
- Wave peaks → potential selling opportunity
Pros and Cons of the Weis Volume Indicator
Pros
- Clearly shows bullish and bearish pressure with color-coded bars
- Numeric values provide real-time volume insights
- Works on all timeframes
- Ideal for Wyckoff-style volume analysis
- Can be combined with indicators like Relative Strength Index (RSI) or Moving Average Convergence Divergence (MACD)
Cons
- May generate false signals during low-volume periods
- Requires basic understanding of volume-based trading
- Does not generate automatic buy or sell alerts
- Numeric overlays may look cluttered to some traders
Best Timeframes for the Weis Volume Indicator
Although the indicator works on all timeframes, many traders find it more reliable on higher timeframes, such as:
- H1 (1 Hour)
- H4 (4 Hours)
- Daily charts
On longer timeframes, volume spikes tend to be more meaningful, which reduces noise and improves signal accuracy.
Conclusion
The Weis Volume Indicator is a powerful tool for traders who want to understand Market Structure, trend direction, and volume strength. By combining wave analysis with volume data, it helps traders identify potential entry points and confirm whether a trend has strong market participation.
While it should not be used as a standalone strategy, combining it with Price Action or momentum indicators can significantly improve trading decisions and overall market analysis.
FAQ
6 Downloads
Published:
Mar 14, 2026 07:50 AM
Category: