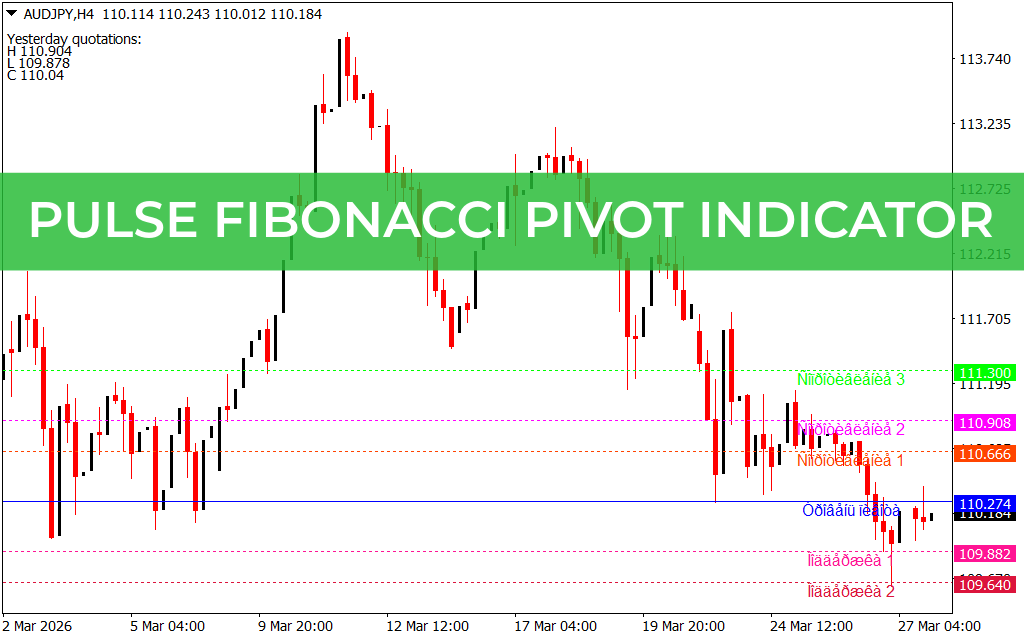
The Pulse Fibonacci Pivot Indicator is a versatile and advanced trading tool that helps traders identify key market levels using Fibonacci-based pivot calculations. By combining traditional pivot point logic with Fibonacci ratios, the indicator offers a more refined and mathematically driven view of Support And Resistance zones.
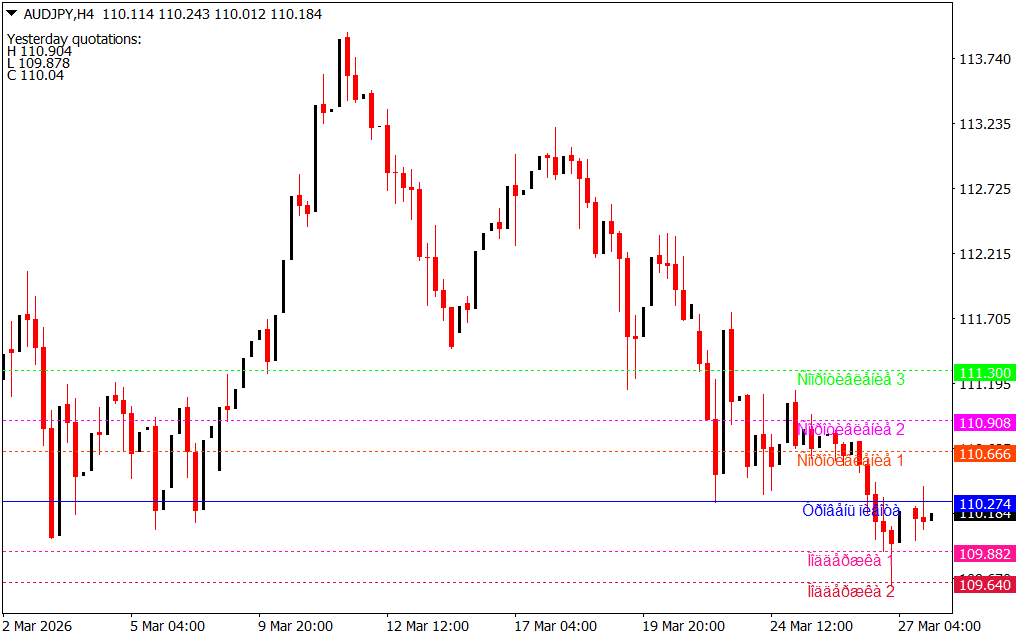
It automatically plots pivot levels on the chart, allowing traders to quickly recognize potential reversal, breakout, or continuation areas without manual calculations. This makes it ideal for traders who rely on technical analysis and structured trading strategies.
How the Pulse Fibonacci Pivot Indicator Works
The indicator calculates levels using the previous day’s high, low, and close, then applies Fibonacci ratios to generate multiple key zones:
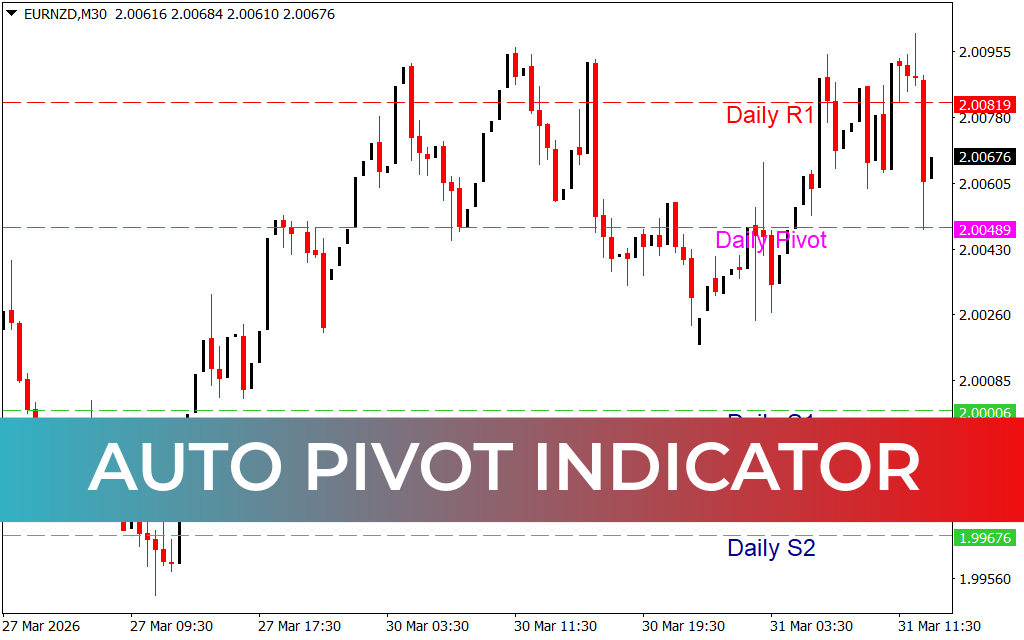
1. Pivot Point (PP)
- The central pivot level acts as a market balance point.
- Price above pivot: Indicates bullish sentiment
- Price below pivot: Indicates bearish sentiment
2. Support Levels (S1, S2, S3)
- Plotted using Fibonacci ratios below the pivot
- Represent potential buying zones
- Price may:
- Bounce upward (reversal)
- Consolidate before moving higher
3. Resistance Levels (R1, R2, R3)
- Plotted above the pivot using Fibonacci extensions
- Act as potential selling zones
- Price may:
- Reverse downward
- Pause before continuing the uptrend
Trading Signals & Strategy
Buy Setup
- Price stays above the pivot point (bullish bias)
- Retraces toward S1 or S2
- Look for bullish confirmation (Price Action)
- Enter buy trade
- Place stop-loss below the next support level
Sell Setup
- Price remains below the pivot point (bearish bias)
- Pulls back toward R1 or R2
- Look for bearish confirmation
- Enter sell trade
- Place stop-loss above the next resistance level
Breakout Strategy
- If price breaks R3 or S3 strongly, it signals:
- High momentum
- Possible trend continuation
- Traders can enter in the breakout direction with proper risk control
Key Benefits
- ✅ Uses Fibonacci ratios for more precise levels
- ✅ Automatically plots pivot, support, and resistance zones
- ✅ Suitable for intraday and swing trading
- ✅ Helps identify market bias quickly
- ✅ Enhances entry, exit, and risk management decisions
Pro Trading Tips
- Combine with trend indicators (like moving averages) for confirmation
- Focus on higher timeframe pivots for stronger levels
- Avoid trading directly at pivot without confirmation
- Use confluence (zones + structure + volume) for best results
Conclusion
The Pulse Fibonacci Pivot Indicator is a powerful upgrade to traditional pivot tools, offering a Fibonacci-based perspective on Market Structure. By clearly identifying key support and resistance levels along with overall market bias, it enables traders to plan trades with greater precision and confidence.
Whether you're a scalper or swing trader, this indicator provides a structured framework for navigating price movements effectively.
FAQ
Published:
Mar 29, 2026 12:08 PM
Category: