The Volume Average Indicator is a simple yet powerful tool designed for traders who want to analyze market volume more effectively in MetaTrader 5. By combining a color-coded volume histogram with a moving average of volume (MA Volume), this indicator helps traders better understand market momentum and the behavior of large market participants.
What Is the Volume Average Indicator?
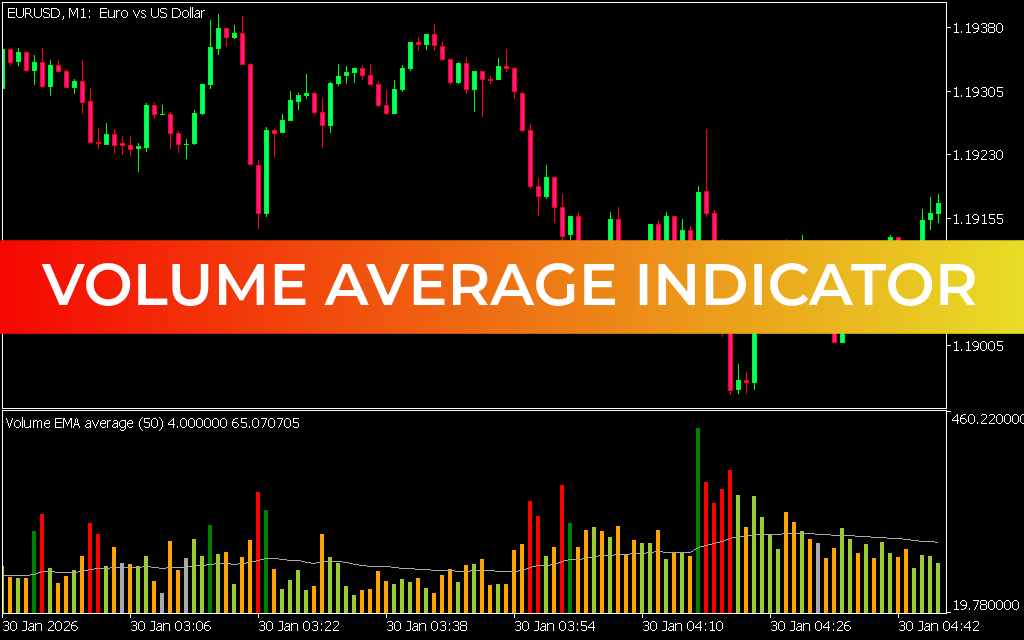
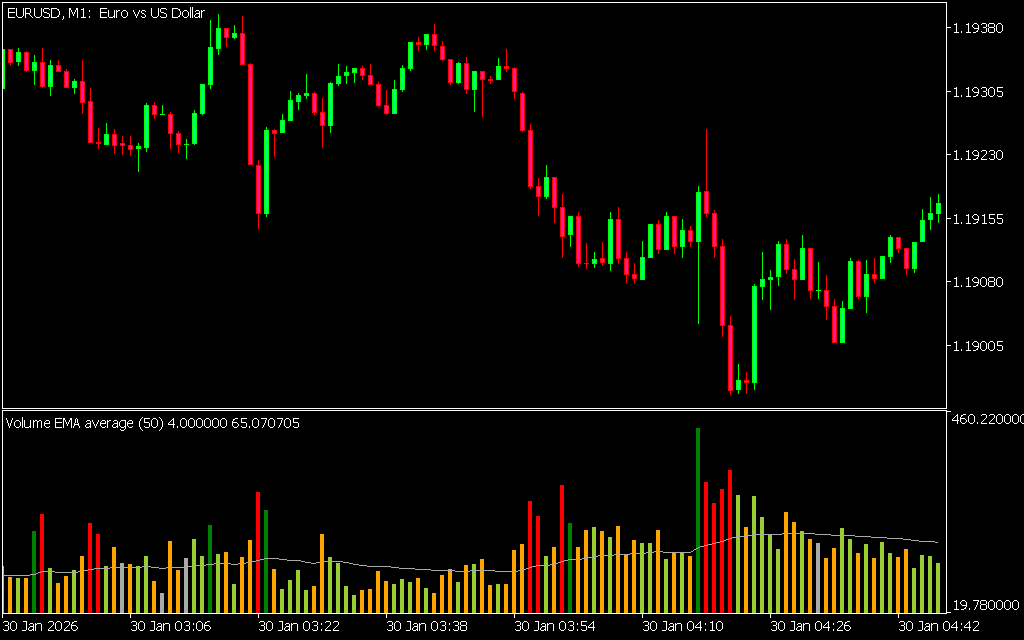
The Volume Average Indicator displays trading volume as a histogram along with a moving average calculated directly from volume data—not price. This provides a clearer picture of buying and selling pressure.
Unlike standard volume indicators in MetaTrader 5, which lack built-in averaging features, this tool integrates both volume and its moving average in one convenient panel.
How the Indicator Works
The histogram uses color-coded bars to simplify interpretation:
- Light Green Bars – Price rising, fast MA Volume below slow MA Volume
- Bright Green Bars – Price rising, fast MA Volume above slow MA Volume
- Yellow Bars – Price falling, fast MA Volume below slow MA Volume
- Bright Red Bars – Price falling, fast MA Volume above slow MA Volume
This color system allows traders to quickly assess whether volume supports or contradicts price movement.
Why Use MA Volume?
The MA Volume is a traditional moving average applied to volume instead of price. It helps smooth out fluctuations and identify trends in trading activity.
In standard MT5 settings, adding a moving average to volume can be difficult. The Volume Average Indicator solves this limitation by including it by default—making it a more efficient tool for volume-based analysis.
How to Use the Indicator in Trading
The Volume Average Indicator does not generate automatic buy or sell signals. Instead, it acts as a supporting tool for traders who rely on volume analysis.
Buy Setup (Bullish Scenario)
In a typical bullish setup (e.g., on a USDJPY M30 chart):
- Price shows bearish candles with narrowing bodies
- Volume remains high during the decline
- This suggests large players are accumulating positions
As selling pressure weakens and accumulation increases, the market often reverses upward. This indicates a potential buying opportunity.
Sell Setup (Bearish Scenario)
In a bearish scenario (e.g., GBPUSD H1 chart):
- Price rises sharply with high volume (strong demand)
- Momentum slows despite increasing volume
- This signals potential supply entering the market
Traders can mark a supply zone and wait for price to retest it. A rejection or false breakout may present a strong short opportunity.
Advantages of the Volume Average Indicator
- Non-repainting for reliable analysis
- Easy-to-use and customizable settings
- Works on all timeframes (intraday to long-term)
- Suitable for multiple markets: forex, stocks, commodities
Limitations
- Does not provide direct buy/sell signals
- Requires knowledge of volume analysis and Market Structure
- Best used alongside other technical analysis tools
Final Thoughts
The Volume Average Indicator is a valuable addition for traders who want deeper insights into volume behavior. While it doesn’t offer instant trading signals, it enhances decision-making by revealing the actions of institutional players and underlying market strength.
To fully leverage its potential, traders should combine it with Supply And Demand analysis and build a solid understanding of volume-based strategies.
Published:
Apr 13, 2026 05:12 AM
Category: