The Wilders DMI Averages Indicator for MT5 is a powerful trend-following tool that helps traders measure both the strength and direction of a trend. Based on the Directional Movement Index (DMI), it combines momentum, trend direction, and volatility insights into a single, easy-to-read indicator.
With its combination of lines and histograms, traders can quickly identify whether the market is trending strongly and in which direction.
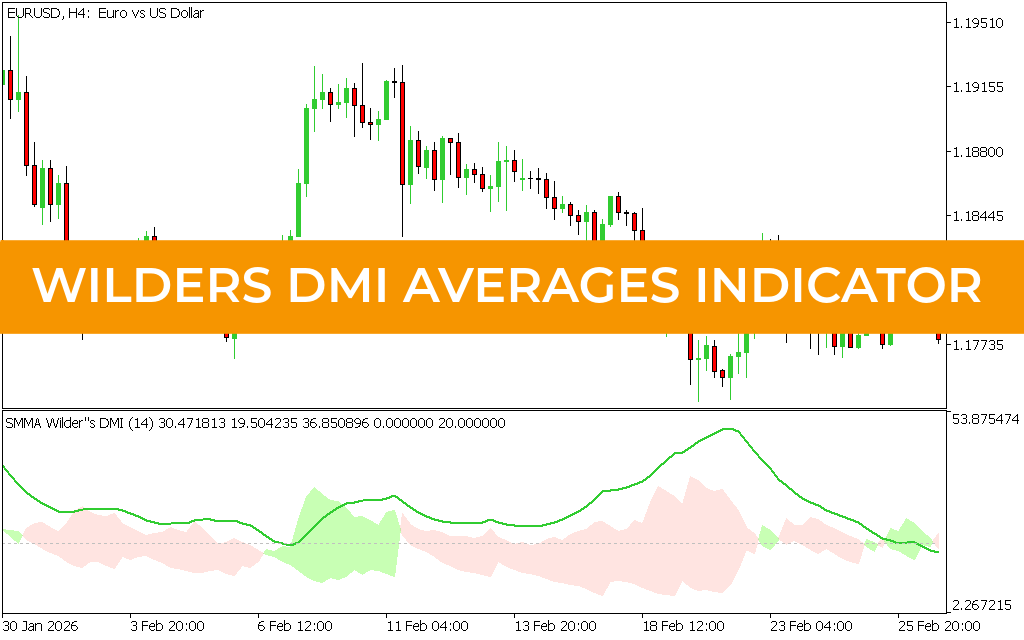
What is the Wilders DMI Averages Indicator?
The indicator consists of:
- Green Line (+DI) → Indicates rising bullish momentum
- Yellow Line (-DI) → Indicates increasing bearish momentum
- Histogram Bars → Show Trend Strength and volatility
It provides a complete overview of market conditions, helping traders decide when to enter, exit, or stay out of trades.
Key Features
- Measures trend strength and direction
- Combines momentum and volatility analysis
- Histogram-based strength confirmation
- Works on all timeframes (Scalping to long-term)
- Suitable for beginners and advanced traders
- Effective for forex, stocks, and other markets
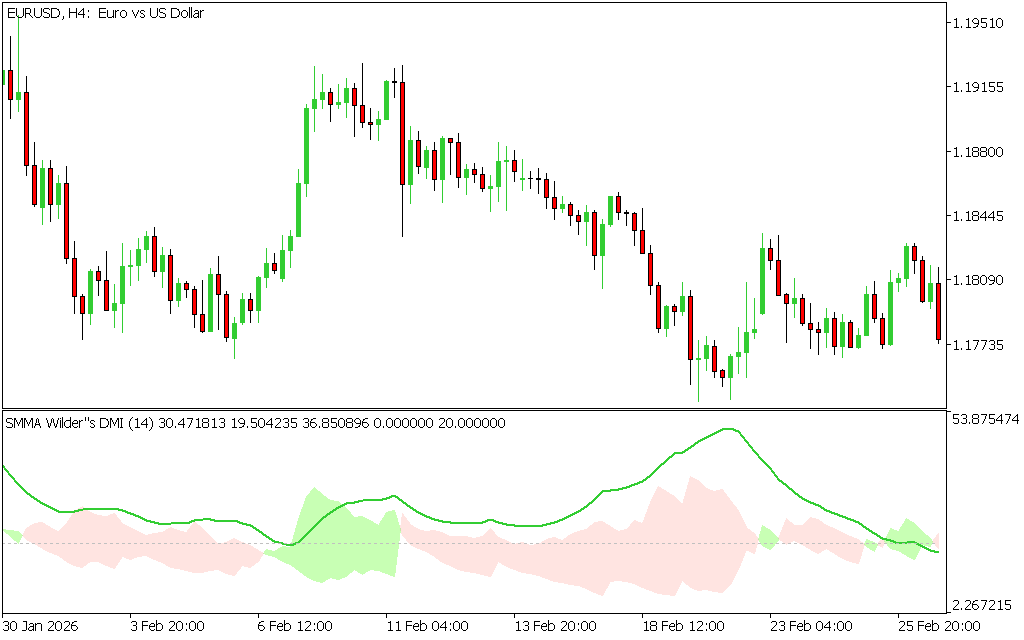
How the Indicator Works
Direction Signals
- +DI (green) above -DI (yellow) → Bullish trend
- -DI (yellow) above +DI (green) → Bearish trend
Strength Signals
- Histogram above 20 → Strong trend
- Histogram below 20 → Weak or ranging market
Histogram Colors
- Lime bars → Bullish strength
- Pink bars → Bearish strength
How to Trade with Wilders DMI Averages
Buy Signal (Bullish Setup)
- Green line (+DI) is above yellow line (-DI)
- Histogram is above level 20
- Histogram turns lime (bullish)
👉 Enter a BUY trade
Stop Loss: Below recent swing low
Take Profit: Based on resistance or trailing stop
Sell Signal (Bearish Setup)
- Yellow line (-DI) is above green line (+DI)
- Histogram is above level 20
- Histogram turns pink (bearish)
👉 Enter a SELL trade
Stop Loss: Above recent swing high
Take Profit: Based on support or trailing stop
Exit Strategy
- Exit when:
- The two lines cross
- Histogram changes color
- Trend strength weakens (below 20)
👉 These are strong signals of a Trend Reversal or slowdown.
Trading Tips
- Trade only when histogram is above 20 for strong trends
- Combine with:
- Support and resistance
- Price Action patterns
- Indicators like RSI
- Avoid trading in low-strength (below 20) conditions
Why Use Wilders DMI Averages?
This indicator helps traders:
- Identify strong trends early
- Avoid weak or sideways markets
- Confirm trend direction and momentum
- Improve trade timing and confidence
Limitations
- Can lag during rapid market changes
- Less effective in ranging markets
- Needs confirmation from other tools
Conclusion
The Wilders DMI Averages Indicator for MT5 is an excellent tool for traders who want to trade strong, high-probability trends. By combining direction, strength, and volatility, it provides a comprehensive view of market conditions.
For best results, focus on trades where the histogram is above 20 and confirm signals using additional tools like RSI and price action analysis.
2 Downloads
Published:
Apr 13, 2026 05:08 AM
Category: