The Volatility Indicator for MetaTrader 4 (MT4) is a powerful technical analysis tool designed to help traders measure market volatility in the forex market. It is especially useful for intraday traders and trend traders who rely on strong price movements to capture profitable opportunities.
Market volatility refers to the speed and magnitude of price changes. When prices move rapidly, volatility is considered high. Conversely, when price movements are slow and limited, volatility is low. Understanding this dynamic helps traders decide when market conditions are favorable for trading.
How the Volatility Indicator Works
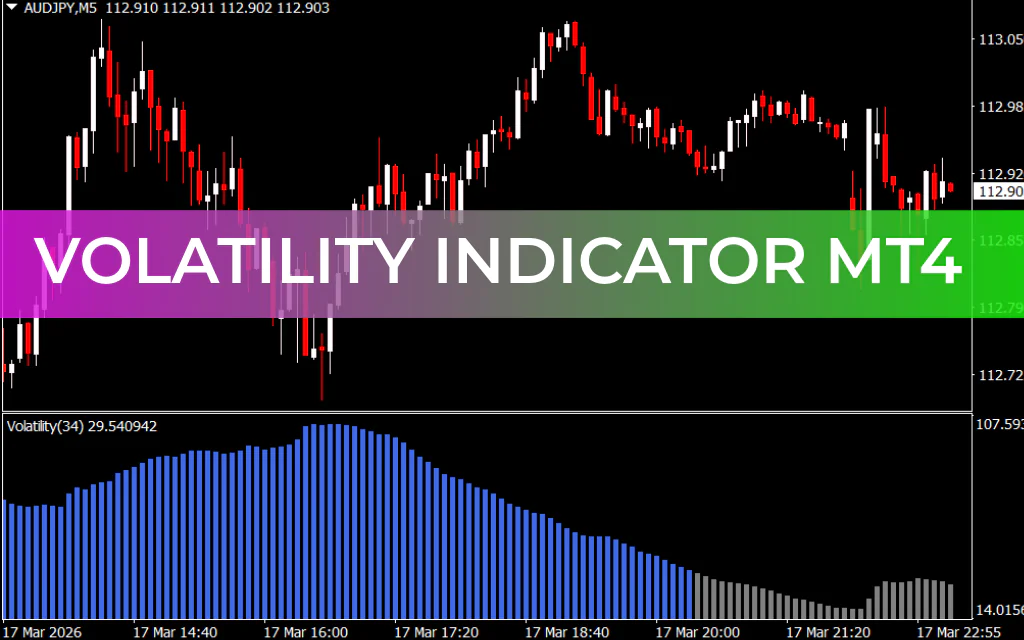
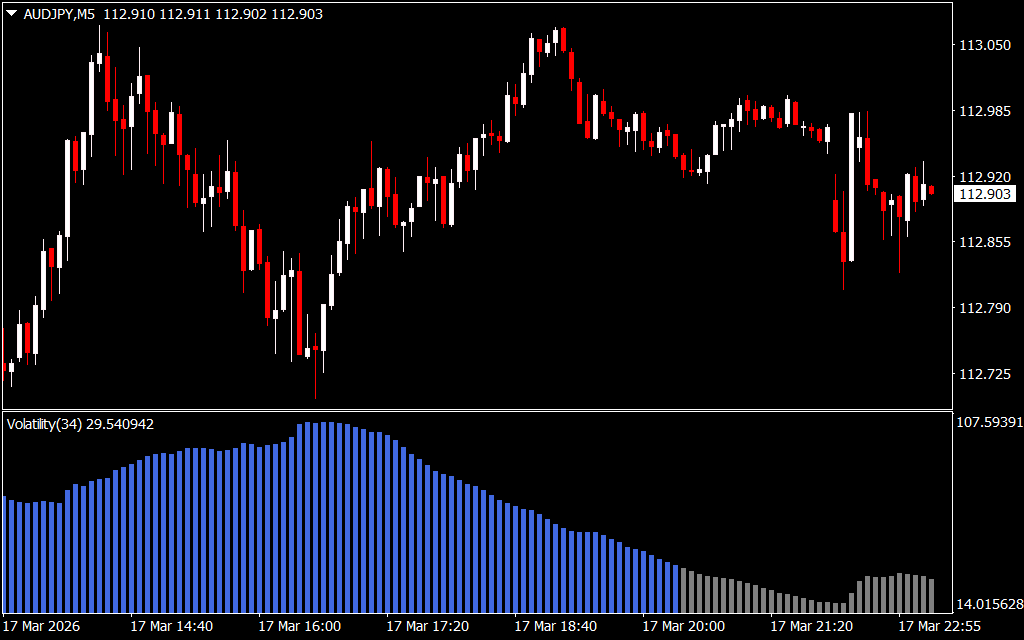
The Volatility Indicator measures market activity by comparing the Exponential Moving Average (EMA) with trading volume. Based on this comparison, the indicator generates a color-coded histogram displayed below the main price chart.
The histogram bars change color to reflect the current volatility level:
- Gray Bars – Indicate low market volatility
- Royal Blue Bars – Indicate high market volatility
The length of the bars also provides useful information:
- Increasing bar length shows rising volatility
- Decreasing bar length indicates declining volatility
By monitoring these histogram changes, traders can quickly determine whether the market environment is suitable for trading.
Understanding Market Volatility with the Indicator
For example, on a EUR/USD H1 chart, the histogram clearly highlights changes in volatility.
When royal blue bars appear, the market typically experiences strong price movement, indicating a trending environment. This is when many traders prefer to enter trades because larger price swings create better profit potential.
In contrast, when gray bars appear, the market tends to move slowly and may enter a consolidation phase. During these periods, price movement is limited and trading opportunities may be less favorable.
How to Use the Volatility Indicator in Trading
Unlike many indicators, the Volatility Indicator does not directly generate buy or sell signals. Instead, it provides valuable information about market conditions, allowing traders to decide whether to enter trades based on their strategy.
Entry Strategy
- Use your preferred trading strategy to identify a potential buy or sell setup.
- Wait for the histogram to show royal blue bars, indicating increasing volatility.
- Enter the trade once strong volatility confirms the potential price movement.
Exit Strategy
Traders should consider closing their positions when:
- The histogram bars start decreasing in size, indicating falling volatility.
- The market begins losing momentum and price movement slows.
This helps traders protect profits before the market enters a low-volatility phase.
Combining the Volatility Indicator with Other Tools
Since the indicator only measures volatility, it works best when combined with other technical indicators such as:
- Trend indicators
- Channel indicators
- Fractal indicators
- Support And Resistance analysis
By combining volatility analysis with Trend Confirmation, traders can improve trade accuracy and timing.
Conclusion
The Volatility Indicator for MT4 provides traders with valuable insight into market activity and trading conditions. By identifying periods of high and low volatility, it helps traders determine when the market is most likely to produce profitable opportunities.
While the indicator does not provide direct buy or sell signals, it is an excellent support tool for confirming market momentum. When combined with other technical analysis strategies, it can significantly improve trading decisions and overall market timing.
FAQ
Published:
Mar 17, 2026 18:17 PM
Category: