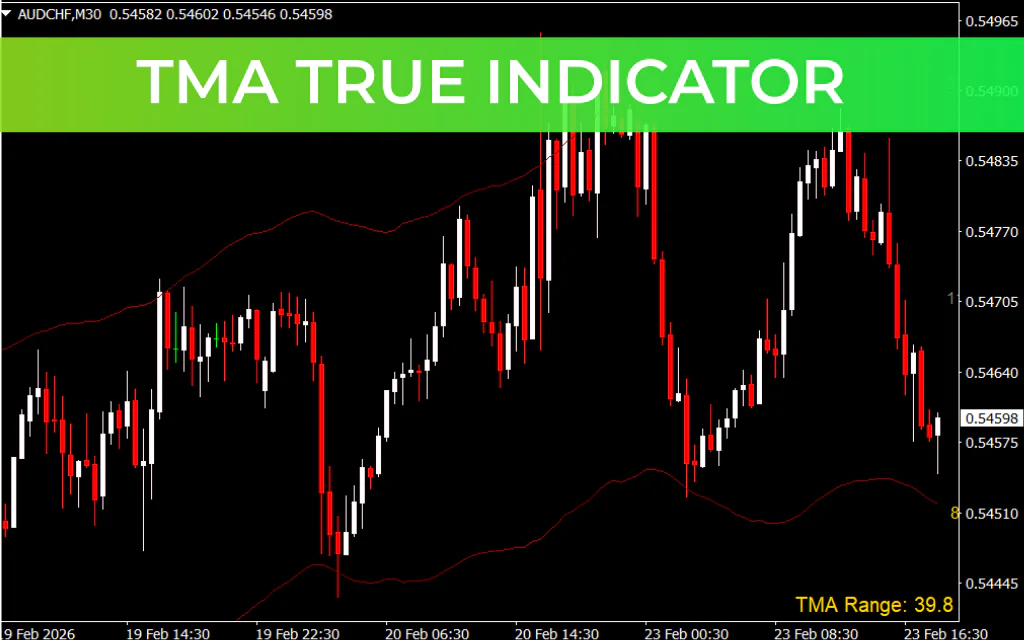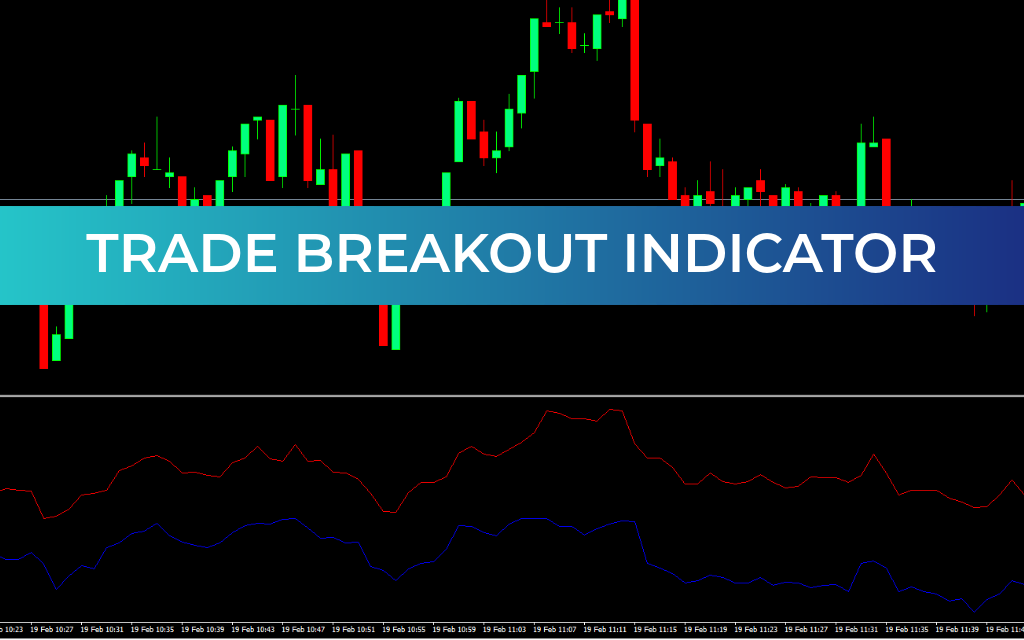
The Trade Breakout Indicator is a MetaTrader 4 tool designed to detect market divergences by plotting red and blue lines directly on the chart. Divergence occurs when the Price Action moves in the opposite direction of an oscillator or technical indicator, signaling potential trend reversals.
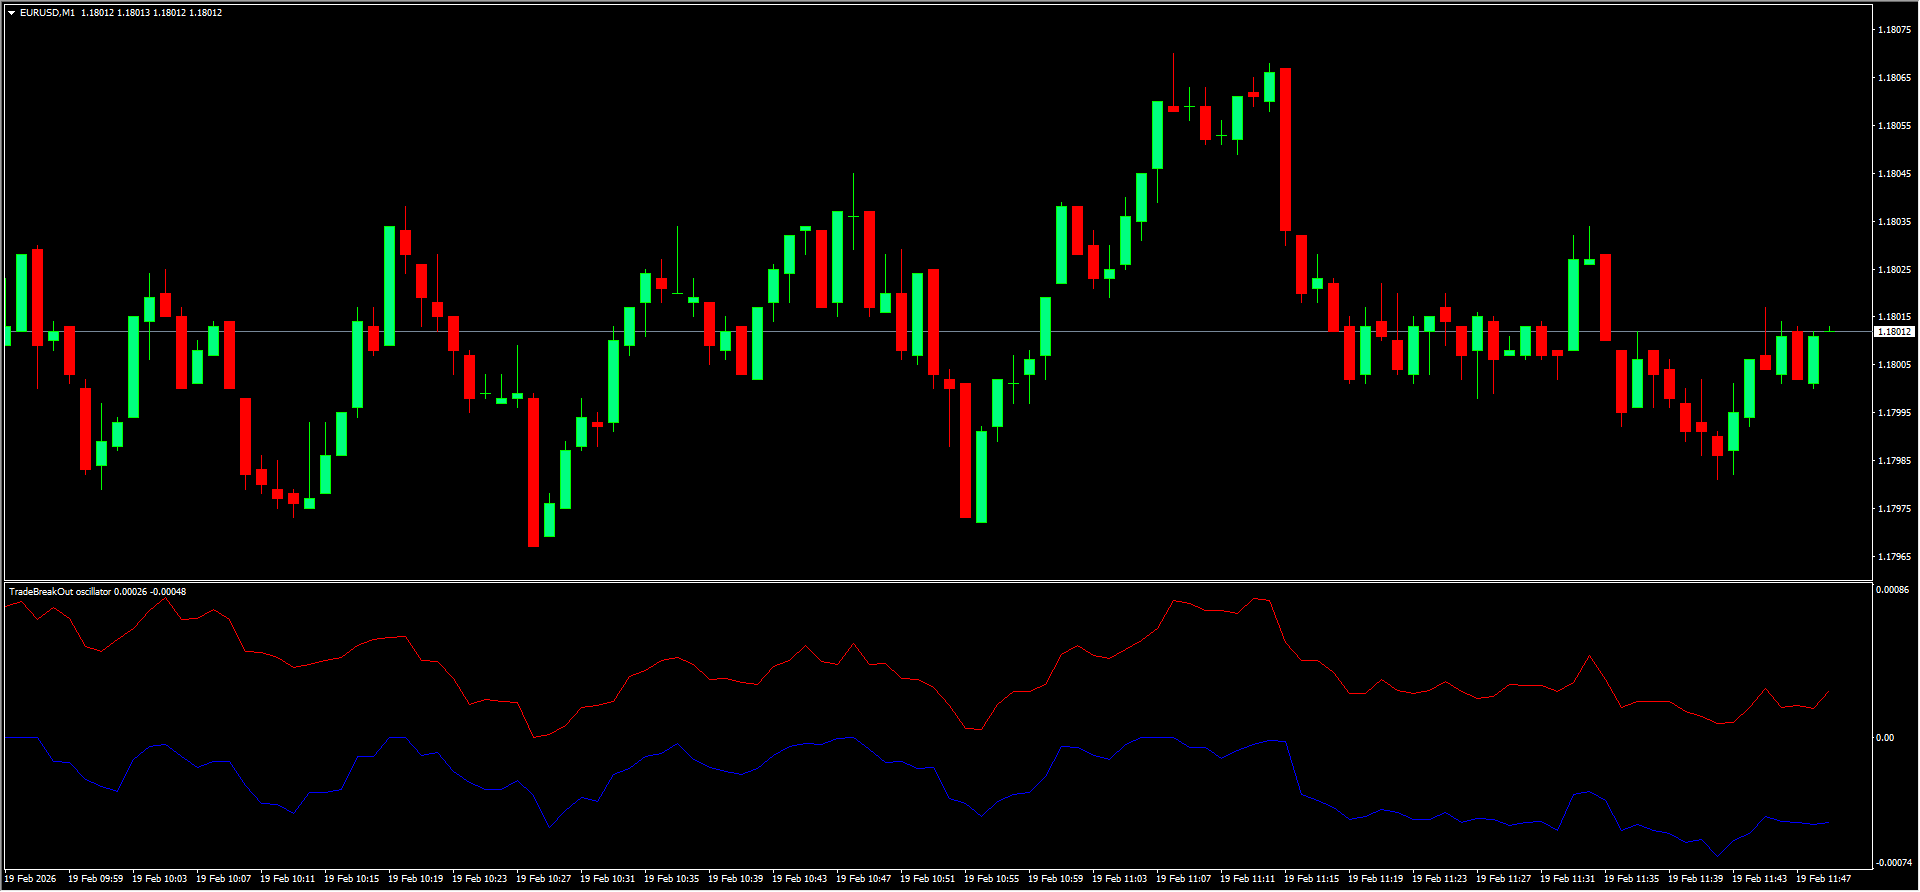
Bullish divergence: Price forms a lower low while the indicator (blue line) forms a higher low → suggests weakening selling pressure and a potential upward reversal.
Bearish divergence: Price forms a higher high while the indicator (red line) forms a lower high → indicates waning buying pressure and a potential downward reversal.
How to Use the Trade Breakout Indicator in MT4
Identify divergences: Watch for situations where the price and indicator move in opposite directions.
Combine with support/resistance levels:
Buy signal: Price breaks above a resistance level, and the blue line forms higher lows while the price forms lower lows.
Sell signal: Price breaks below a support level, and the red line forms lower highs while the price forms higher highs.
Confirm entries: Use other technical tools such as trendlines, moving averages, or candlestick patterns for confirmation.
The indicator helps traders spot potential reversals and plan entry and exit points effectively by highlighting divergences in real-time.
Conclusion
The Trade Breakout Indicator for MT4 is a powerful tool for detecting bullish and bearish divergences, enabling traders to anticipate potential market reversals and make informed trading decisions. By combining divergence analysis with Support And Resistance levels, traders can improve timing and accuracy of their trades.
FAQ
Last Update:
Feb 19, 2026 09:55 AM
Published:
Feb 19, 2026 04:52 AM
Category: