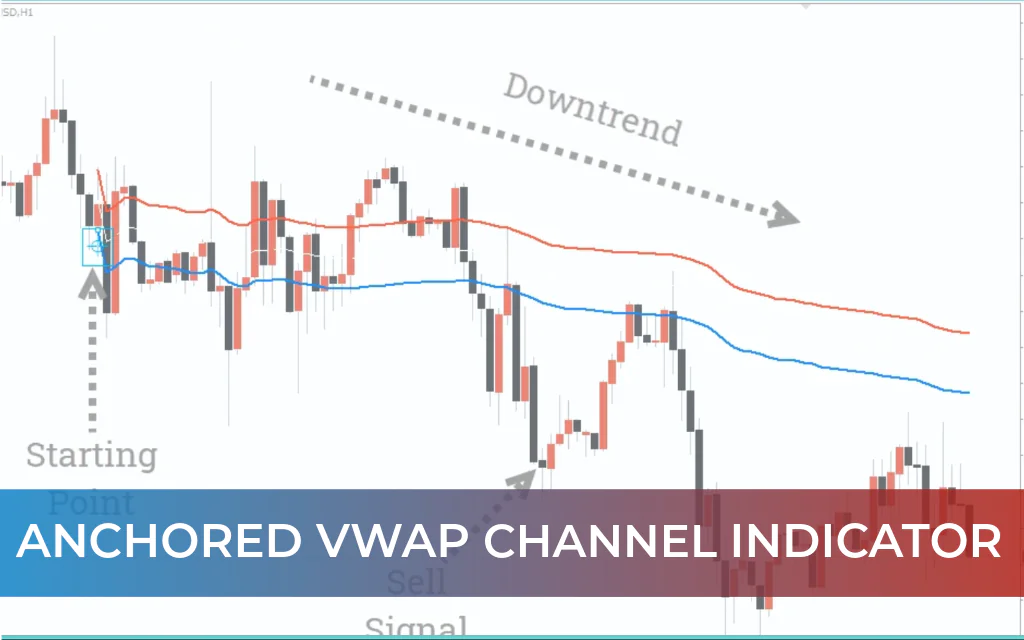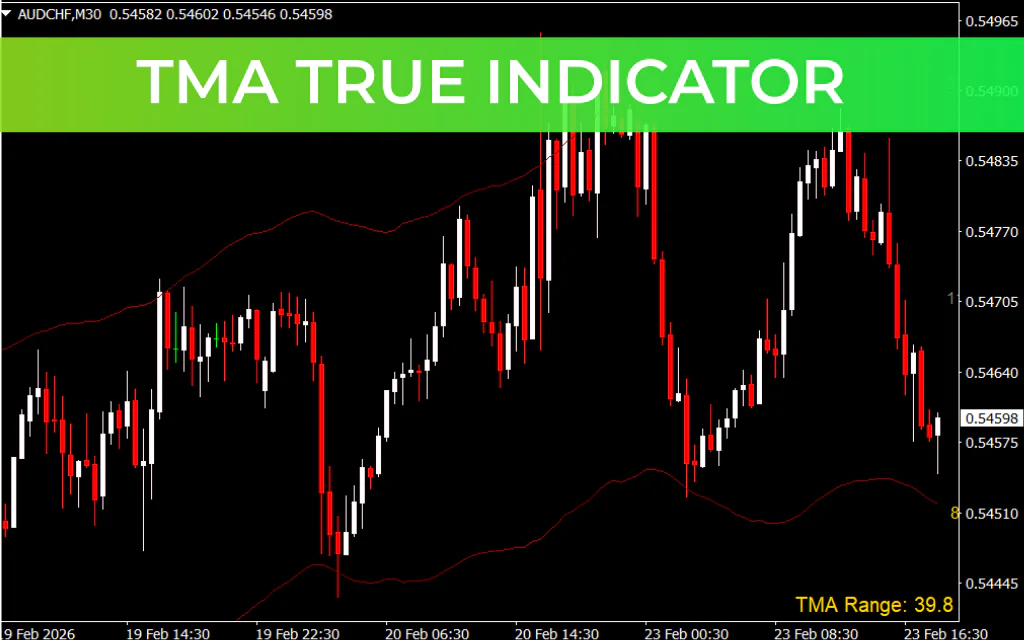
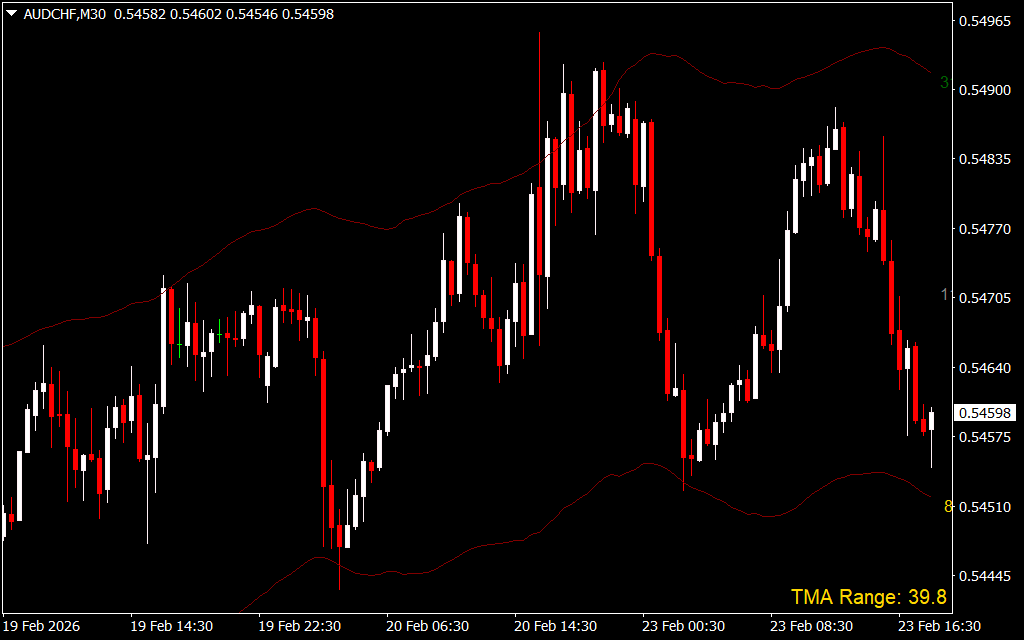
The TMA True Indicator is a robust trading tool designed to provide accurate trend and volatility analysis without the common issue of repainting. By plotting dynamic upper, middle, and lower bands that adjust to market volatility, this indicator helps traders identify potential breakouts, reversals, and trend continuations with confidence. It is suitable for scalpers, swing traders, and long-term trend followers, offering reliable insights for smarter trade decisions.
How It Works
The TMA True Indicator signals market conditions based on price interactions with its bands:
- Upper Band:
- Price reaches this level → market may be overbought
- Signals a possible downtrend or retracement
- Lower Band:
- Price reaches this level → market may be oversold
- Suggests a potential upward reversal
- Middle Line:
- Acts as a dynamic trend filter
- Price above middle line → bullish trend
- Price below middle line → bearish trend
Traders can combine these signals with other technical tools to confirm trade setups, optimize entries, and improve exit timing.
Key Benefits
- Non-repainting: Signals remain stable after appearing
- Adaptive bands: Expand and contract based on market volatility
- Trend identification: Clearly distinguishes bullish, bearish, and neutral conditions
- Entry/exit optimization: Supports Scalping, swing trading, and long-term strategies
- Enhanced market timing: Identifies high-probability trade setups
Conclusion
The TMA True Indicator is an essential tool for traders aiming to enhance trend analysis and market timing. Its adaptive bands provide dynamic Support And Resistance levels, helping traders make informed decisions in both trending and volatile markets. By eliminating repainting issues, the indicator ensures reliable signals, making it a valuable asset for all trading styles, from scalping to long-term investing.
FAQ
2 Downloads
Published:
Feb 23, 2026 12:57 PM
Category: