Free
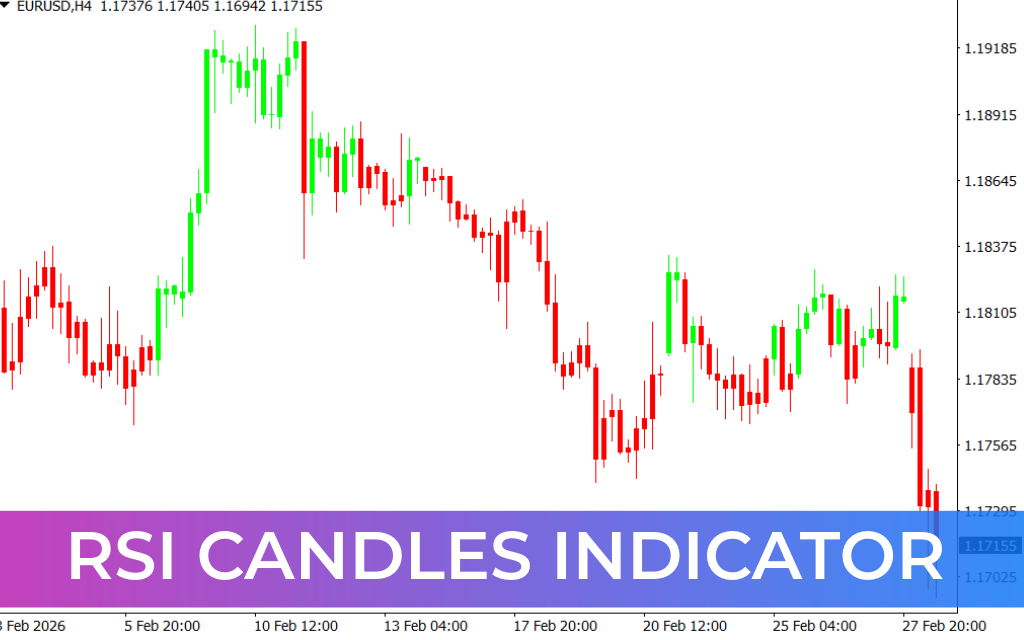
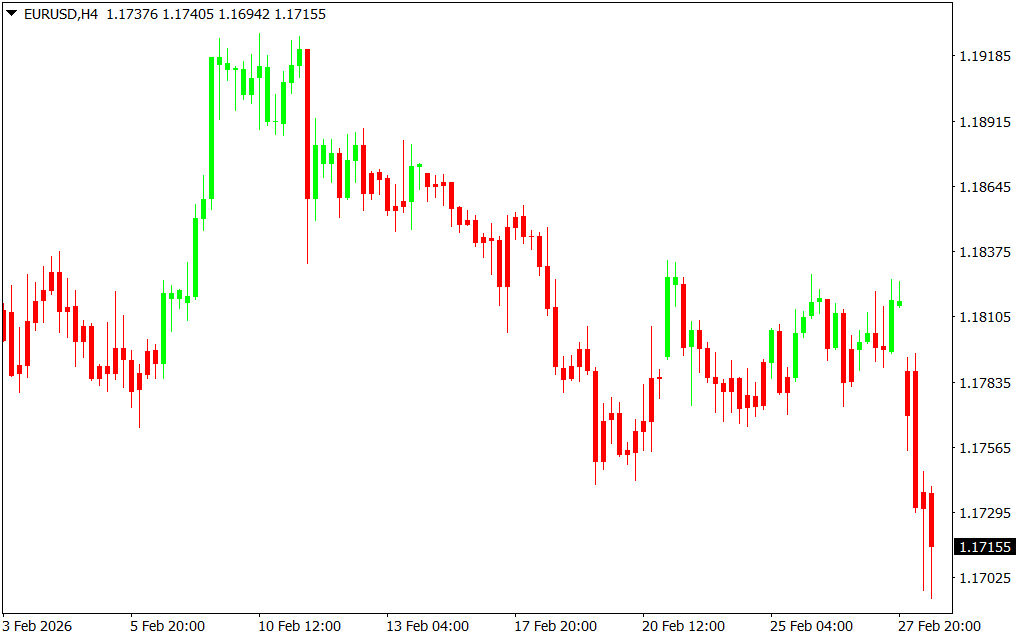
The RSI Candles indicator for MetaTrader 4 is a trend analysis tool that displays the value of the Relative Strength Index (RSI) directly on candlesticks. Unlike the traditional RSI, which appears in a separate window, this indicator colors each candlestick to reflect bullish or bearish market sentiment.
How the RSI Candles Indicator Works
- Core principle: The indicator works around the 50.00 RSI level.
- Above 50.00: Bullish sentiment → candlestick colored lime
- Below 50.00: Bearish sentiment → candlestick colored red
- Purpose: Focuses on trend direction, not overbought/oversold conditions.
How to Trade Using RSI Candles
- Trend identification:
- Lime candlesticks indicate an uptrend or bullish market momentum.
- Red candlesticks indicate a downtrend or bearish market momentum.
- Trade setup example:
- On EUR/USD, if multiple consecutive red candlesticks appear, it indicates strong bearish pressure → consider selling opportunities.
- Conversely, consecutive lime candlesticks suggest bullish momentum → consider buying opportunities.
- Best practices:
- Use in combination with Price Action, support/resistance levels, or other technical indicators to confirm trades.
- Do not rely on this indicator as a standalone trading signal.
Benefits of Using RSI Candles
- Displays trend direction directly on candlesticks for easy visualization.
- Eliminates the need to reference the traditional RSI window.
- Simplifies trading decisions by showing bullish vs bearish market sentiment at a glance.
- Works well on all chart timeframes.
- Suitable for both new and advanced traders.
Conclusion
The RSI Candles indicator for MT4 is a straightforward forex trading tool that colors candlesticks based on RSI values. It helps traders quickly identify bullish and bearish market trends and can be effectively combined with other technical analysis tools for better trading decisions.
FAQ
Unlike traditional RSI in a separate window, it colors each candlestick to reflect bullish or bearish sentiment. Works around the 50.00 RSI level. Above 50.00 = bullish sentiment, candlestick colored lime. Below 50.00 = bearish sentiment, candlestick colored red. Focuses on trend direction, not overbought/oversold.
Lime = uptrend or bullish market momentum. Red = downtrend or bearish market momentum.
Multiple consecutive red candlesticks = strong bearish pressure → consider selling. Consecutive lime candlesticks = bullish momentum → consider buying.
Displays on candlesticks. Focuses on 50 level (trend) not overbought/oversold. Visual integration with price.
Traders wanting trend direction on the chart. Those preferring 50-level focus over extremes.
4 Downloads
Published:
Mar 02, 2026 09:37 AM
Category:
Share: