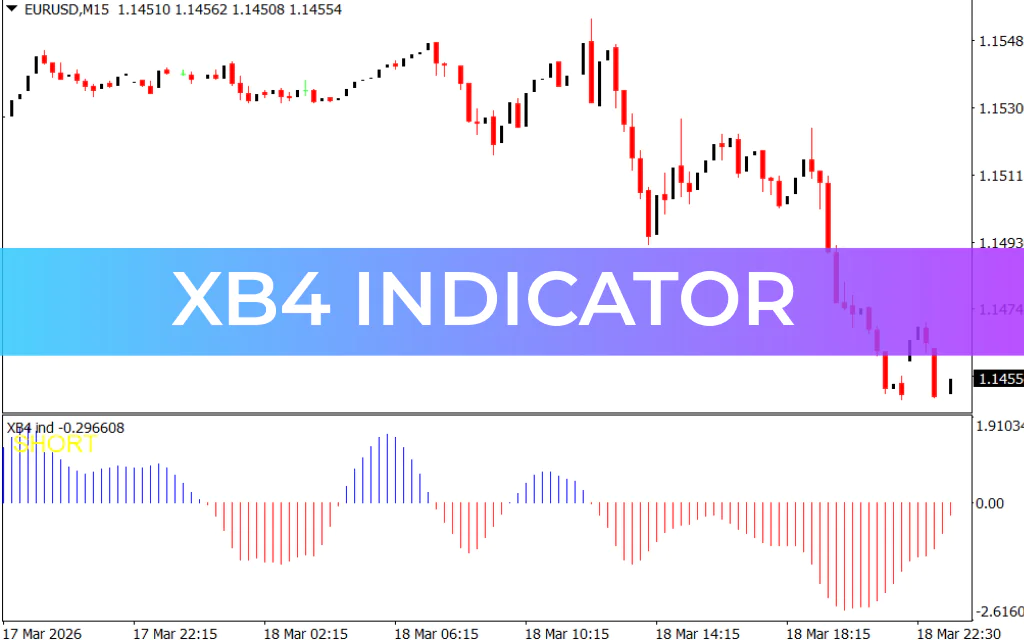
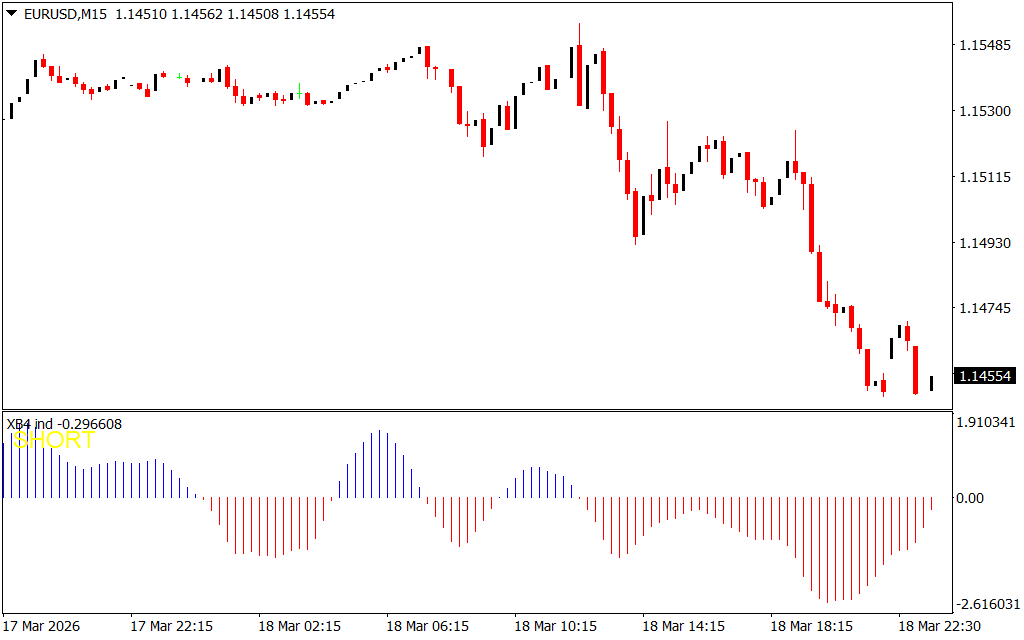
The XB4 Indicator for MT4 is a user-friendly trading tool designed to help traders identify buy and sell opportunities with minimal effort. The indicator is divided by a 0-level line, forming a blue histogram above and a red histogram below. This visual separation makes it easy to recognize bullish and bearish trends.
The indicator is suitable for both novice and experienced traders and works on any currency pair. While it can be applied for long-term trading, it performs best on shorter timeframes of 1-hour or lower.
How the XB4 Indicator Works
The XB4 Indicator signals trend direction and strength using its histogram colors:
- Blue Histogram Above 0-Level: Signals a bullish trend (buy). The further the histogram extends from the 0-level, the stronger the uptrend.
- Red Histogram Below 0-Level: Signals a bearish trend (sell). The further the histogram extends downward, the stronger the downtrend.
The indicator also posts a text signal at the top-left of the indicator window, showing whether to go long or short, making it easy to interpret without manual calculations or drawing lines.
Trading Signals
Buy Signal
- Wait for the histogram to shift from red to blue above the 0-level line.
- This indicates the beginning of a bullish trend.
- Enter a long position once the color change is confirmed.
- Consider the histogram’s distance from the 0-level to gauge Trend Strength.
Sell Signal
- Wait for the histogram to shift from blue to red below the 0-level line.
- This signals the start of a bearish trend.
- Enter a short position after confirmation.
- The further the red histogram extends downward, the stronger the downtrend.
Exit Strategy
- Long Position Exit: Close when the histogram changes from blue to red.
- Short Position Exit: Close when the histogram changes from red to blue.
- Be cautious when the histogram oscillates near the 0-level, as this indicates a weak trend that may reverse unexpectedly.
Practical Example
On a GBP/JPY chart, the XB4 indicator shows a blue histogram forming above the 0-level, indicating the start of an uptrend. As the histogram elongates upward, the trend strengthens. Once the histogram starts sloping downward and eventually turns red below the 0-level, it signals the end of the uptrend and the start of a potential downtrend—prompting traders to exit long positions.
Conclusion
The XB4 Indicator for MT4 is a straightforward tool perfect for beginners. By simply watching histogram color changes, traders can spot buy and sell opportunities easily. For more accurate trading, it’s recommended to combine the XB4 Indicator with other technical tools to confirm signals and enhance trading confidence.
FAQ
1 Download
Published:
Mar 18, 2026 18:46 PM
Category: