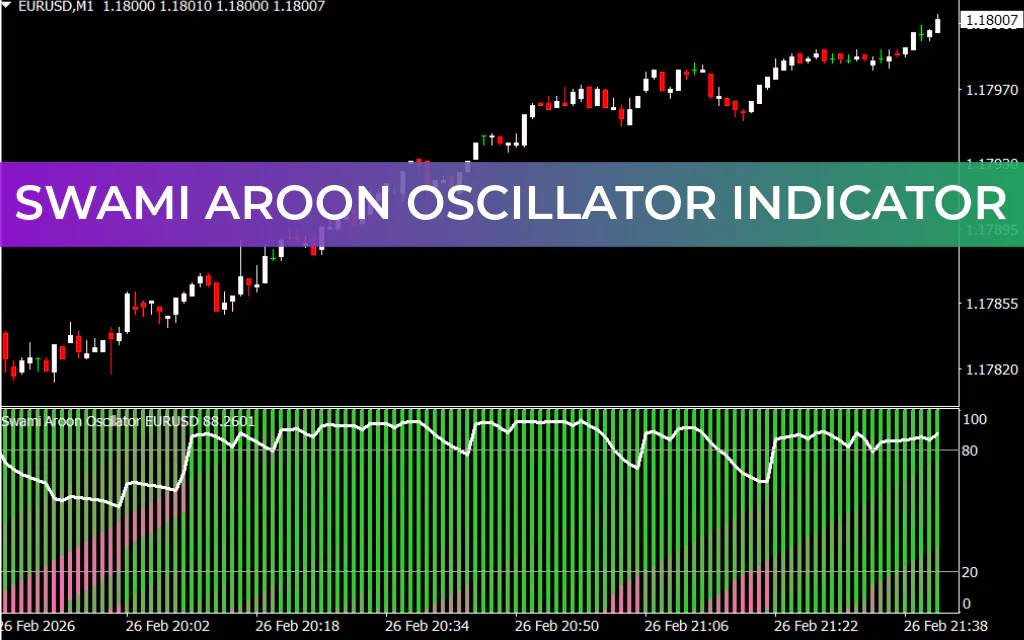
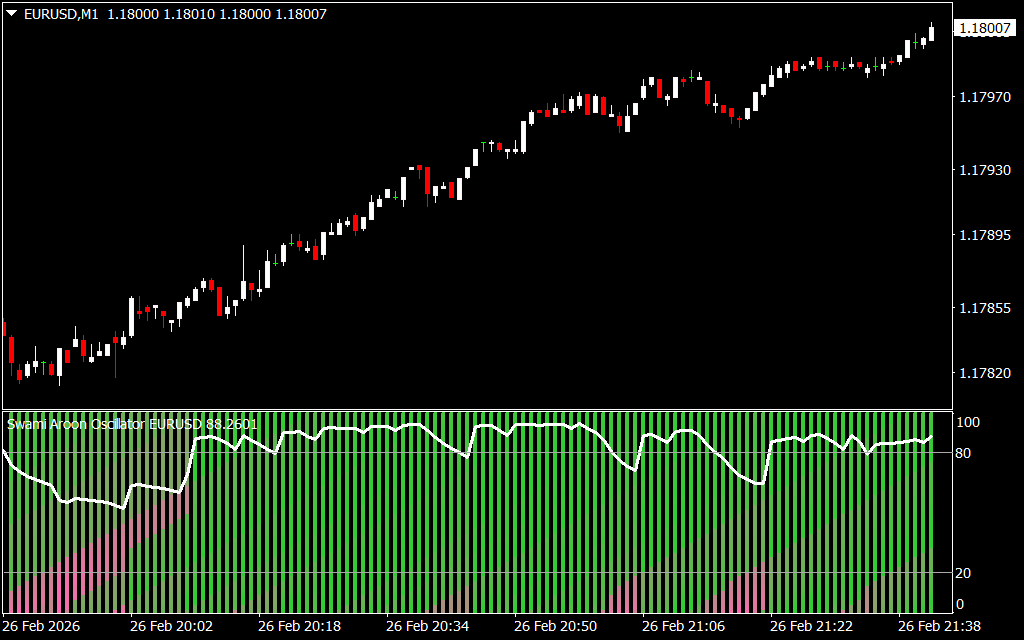
The Swami Aroon Oscillator Indicator for MT4 is a momentum-based tool that helps traders identify overbought and oversold market conditions. Like most oscillators, it fluctuates between 0 and 100, providing clear visual cues for potential reversal zones and Trend Strength.
This indicator works across all timeframes and is suitable for scalpers, intraday traders, and long-term Forex traders.
How the Swami Aroon Oscillator Works
The oscillator displays values between 0 and 100:
- Above 80: Market is overbought
- Below 20: Market is oversold
In addition to the oscillator line, the indicator features color-coded bars that focus on recent Price Action:
- Lime Green Bars: Bullish market condition
- Hot Pink Bars: Bearish market condition
The color gradually shifts depending on momentum:
- As the oscillator rises → bars turn lime green
- As it falls → bars turn hot pink
This visual transition makes it easy to quickly assess trend direction and strength.
How to Trade with the Swami Aroon Oscillator
Buy Setup
- Look for hot pink bars indicating a recent downtrend
- Wait until the oscillator drops below 20 (oversold zone)
- Enter a buy trade
- Exit when the oscillator moves into the overbought region (above 80)
Sell Setup
- Look for lime green bars indicating a bullish trend
- Wait until the oscillator rises above 80 (overbought zone)
- Enter a sell trade
- Exit when the oscillator falls into the oversold region (below 20)
For improved accuracy, combine the Swami Aroon Oscillator with Support And Resistance levels or other confirmation indicators.
Key Features and Benefits
- ✔ Clear overbought and oversold signals
- ✔ Easy-to-read color-coded momentum bars
- ✔ Works on all MT4 timeframes
- ✔ Suitable for Scalping and long-term strategies
- ✔ Helps identify trend direction quickly
Conclusion
The Swami Aroon Oscillator Indicator for MT4 is a practical and visually intuitive tool for identifying overbought and oversold market conditions. Its color-coded bars make trend analysis faster and easier, allowing traders to make timely buy and sell decisions. When combined with other technical tools, it can significantly improve trading accuracy and confidence.
FAQ
Published:
Feb 26, 2026 15:44 PM
Category: