The RBCI Histogram Indicator for MT4 (Relative Breadth Cycle Indicator) is a powerful tool that helps traders analyze buying and selling pressure while identifying trend direction, strength, and potential reversals. By visualizing market momentum through a histogram, this indicator enables traders to pinpoint precise entry points and better understand overall market conditions.
Designed for both beginner and advanced forex traders, the RBCI indicator is simple to interpret and works seamlessly across all timeframes—from intraday charts to daily, weekly, and monthly analysis. Its ability to reflect real-time market pressure also makes it suitable for automated trading strategies.
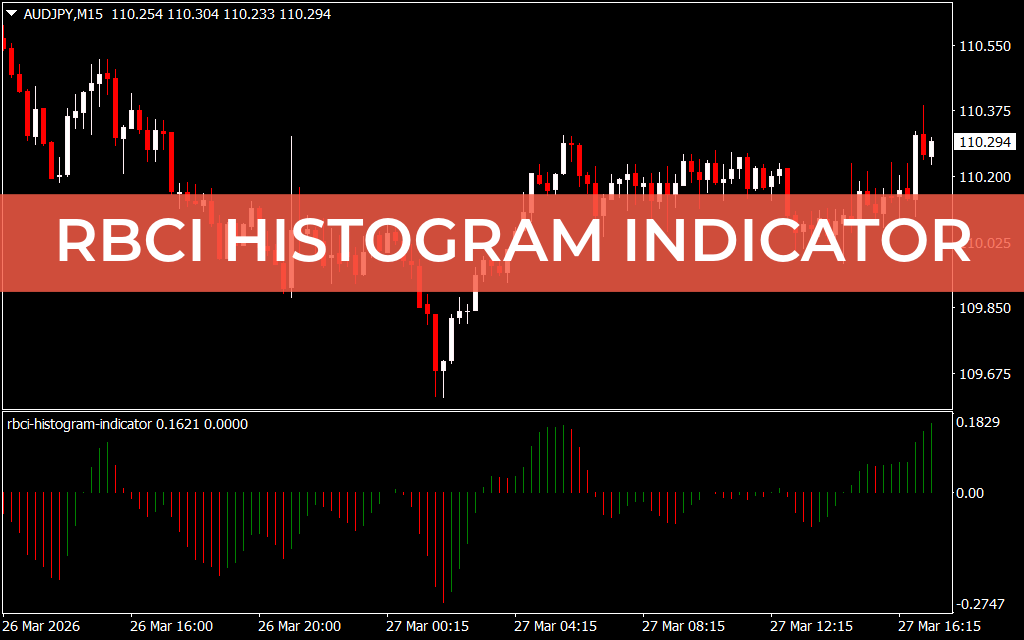
RBCI Histogram Indicator Trading Signals
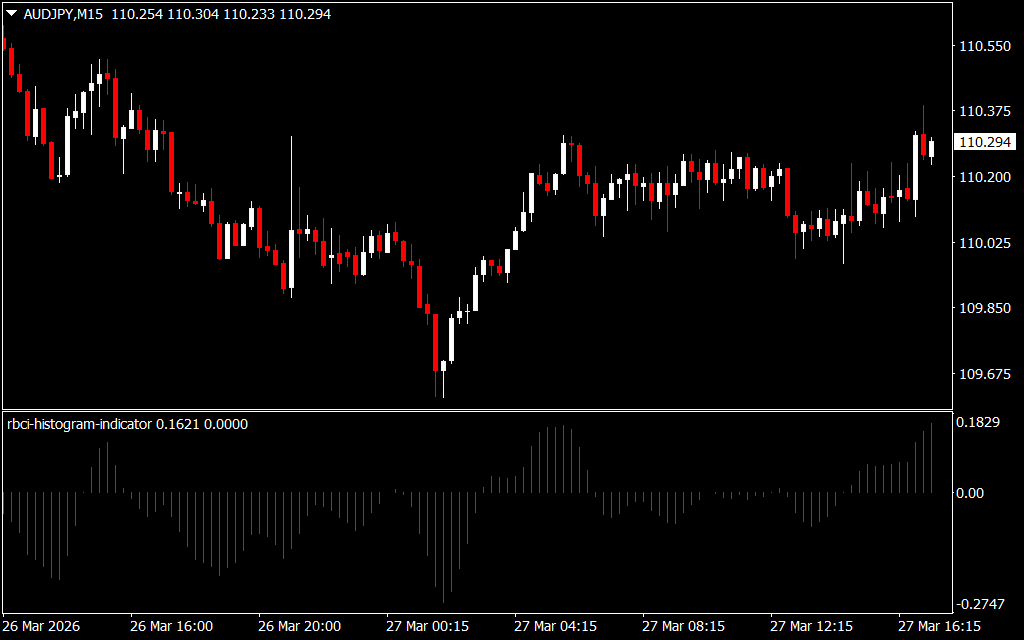
The indicator displays a histogram with a ZERO line:
- Green Bars: Indicate bullish pressure (buyers in control)
- Red Bars: Indicate bearish pressure (sellers in control)
- Distance from ZERO Line: Reflects the strength of the trend (larger bars = stronger momentum)
Trading Strategy:
- Buy Signal:
- When green histogram bars appear above the ZERO line
- Confirms bullish trend and buying pressure
- Enter a buy trade with a stop-loss below the previous swing low
- Sell Signal:
- When red histogram bars appear below the ZERO line
- Signals bearish trend and selling pressure
- Enter a sell trade with a stop-loss above the previous swing high
- Reversal Signals:
- A change in histogram color may indicate an early Trend Reversal
- Use this as a warning signal and confirm with other indicators
- Exit Strategy:
- Close trades on opposite signals or based on a solid risk-to-reward ratio
Why Use the RBCI Histogram Indicator?
- Visualizes buying and selling pressure clearly
- Identifies trend direction and strength
- Provides early warning of potential reversals
- Works across all timeframes and trading styles
The RBCI Histogram Indicator for MT4 is an essential tool for traders who want to gain deeper insight into market momentum and trend behavior, helping improve timing and overall trading performance.
Download the RBCI Histogram Indicator for MT4 today and trade with confidence using clear trend and pressure signals!
FAQ
Published:
Mar 27, 2026 12:21 PM
Category: