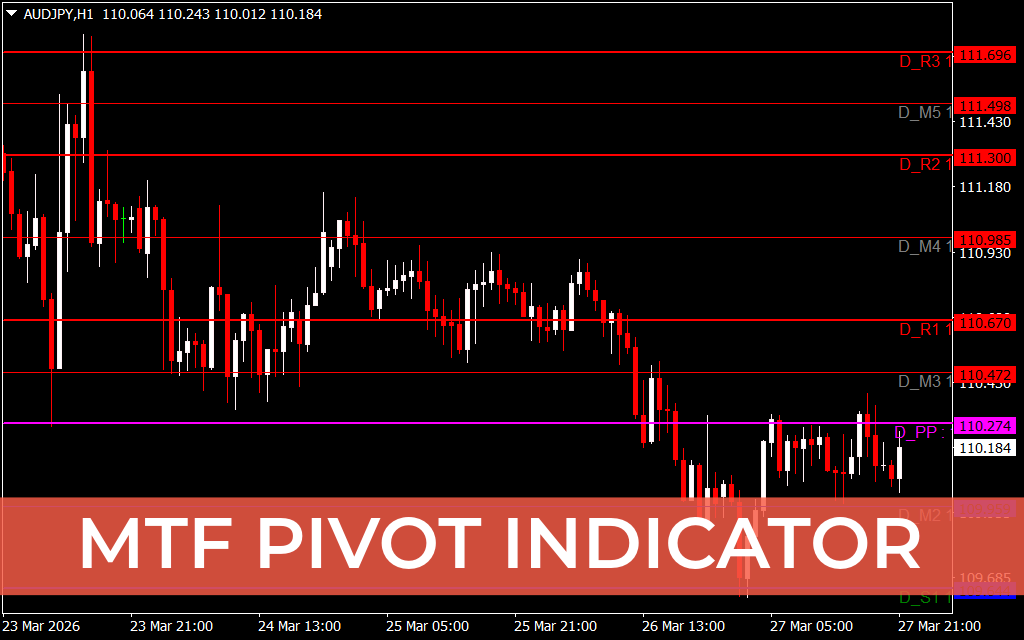
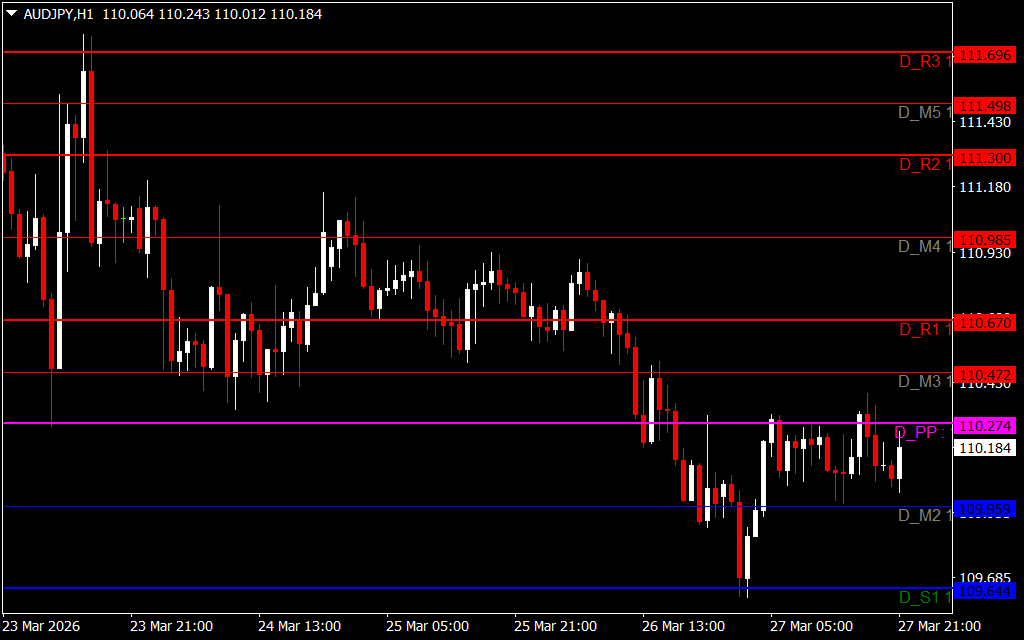
The MTF Pivot Indicator is a powerful trading tool designed to help traders analyze key pivot levels across multiple timeframes simultaneously. By consolidating daily, weekly, and monthly pivots into a single chart, this indicator provides a clear overview of potential Support And Resistance areas, making it invaluable for both novice and experienced traders. Its multi-timeframe approach ensures precise decision-making and allows users to adapt to changing market conditions effectively.
Key Features of the MTF Pivot Indicator
- Multi-Timeframe Analysis: Displays daily, weekly, and monthly pivot levels on one chart for comprehensive market insight.
- Support & Resistance Signals: Identifies critical levels where price may reverse or continue trends.
- Bullish & Bearish Indicators: Price above pivot points signals bullish momentum, while below indicates bearish sentiment.
- Enhanced Trading Decisions: Integrates seamlessly with other technical analysis tools to optimize entries and exits.
- Risk Management: Helps traders improve timing and risk-to-reward ratios for more strategic trades.
The MTF Pivot Indicator streamlines market analysis by combining multiple timeframe pivots into a single, easy-to-read chart. By pinpointing high-probability support and resistance levels, it equips traders to make informed decisions and maximize profitability.
Download the MTF Pivot Indicator today to enhance your trading strategy and gain a competitive edge.
FAQ
1 Download
Published:
Mar 29, 2026 12:39 PM
Category: