he Double Stochastic RSI Indicator for MT4 combines two of the most popular oscillators used in technical analysis: Relative Strength Index and Stochastic Oscillator. Both indicators are widely used by traders to detect overbought and oversold conditions in the market and identify potential reversal opportunities.
While the Stochastic Oscillator is known for being more sensitive to price changes, the RSI provides smoother signals. By combining these two oscillators, the Double Stochastic RSI Indicator offers a balanced approach for analyzing market momentum and spotting potential entry points.
Key Features of the Double Stochastic RSI Indicator
- Combined Oscillator Analysis: Integrates Stochastic and RSI indicators into a single tool.
- Overbought/Oversold Detection: Helps traders identify potential reversal zones.
- Non-Repainting Signals: Historical signals remain unchanged.
- Flexible Settings: Traders can customize levels and colors.
- Multi-Market Compatibility: Works with forex, cryptocurrencies, stocks, and commodities.
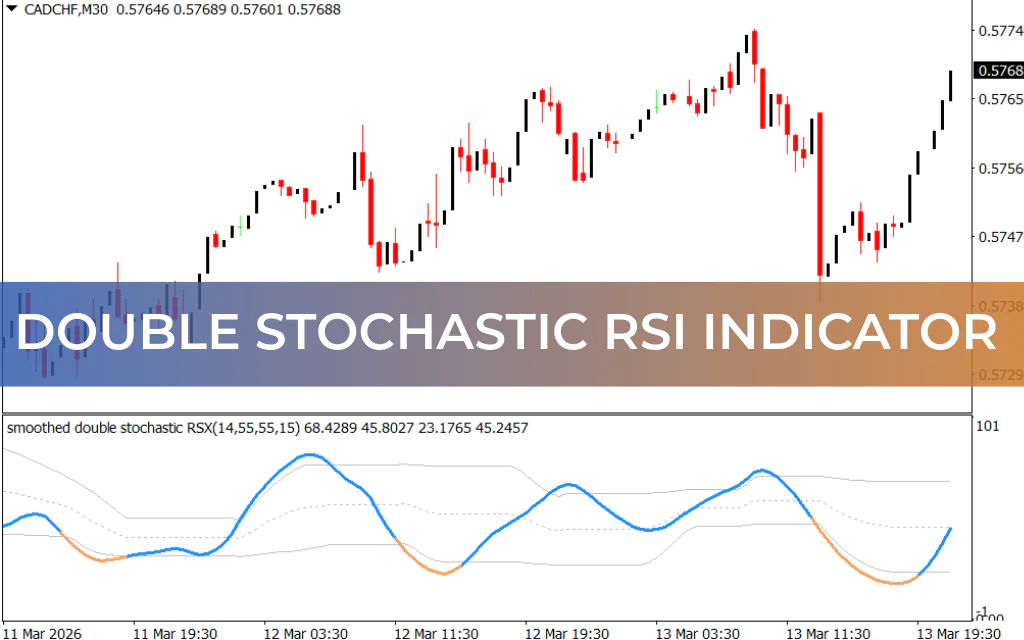
How the Double Stochastic RSI Indicator Works
The indicator consists of:
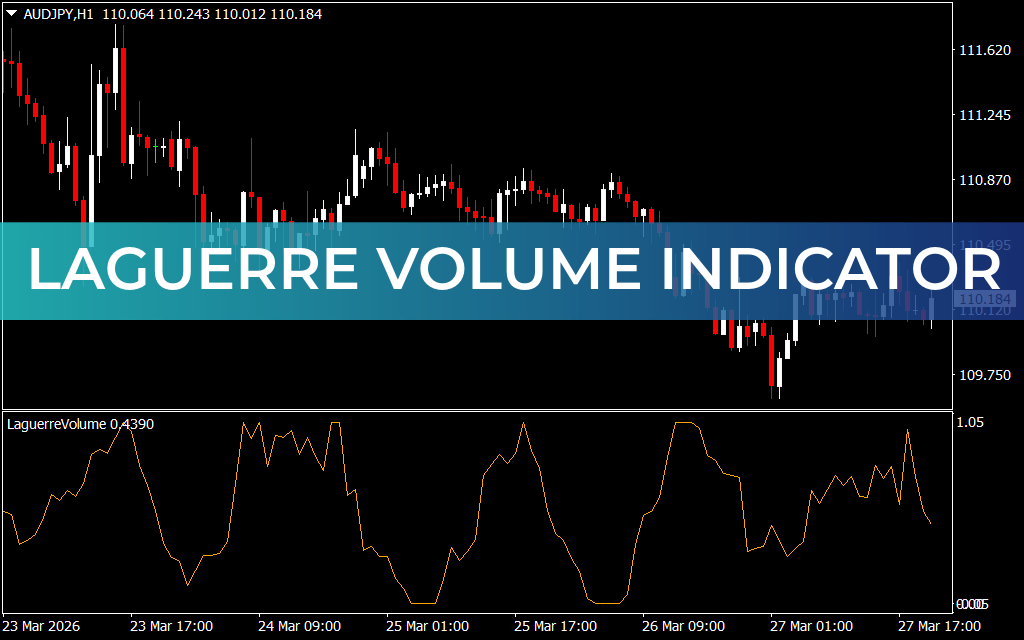
- Main Line: Oscillates between values of 0 and 100.
- Dynamic Overbought Level: Signals that the price may be excessively high.
- Dynamic Oversold Level: Indicates that the price may be unusually low.
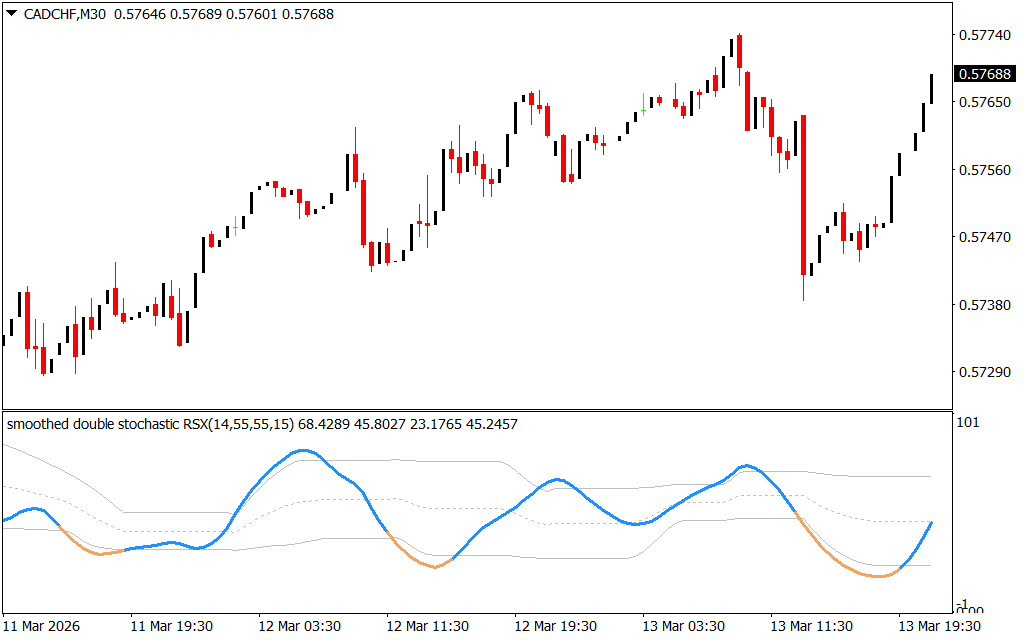
Interpreting the Indicator
- Above Overbought Level:
When the main line rises above the overbought zone, it often signals extremely high prices or a strong bullish trend. - Below Oversold Level:
When the main line drops below the oversold zone, it may indicate extremely low prices or a strong bearish trend.
Buy Signal Example
A BUY signal typically forms when two conditions occur:
- The main line exits the oversold zone.
- The price chart confirms the move with support or resistance interaction.
For example, if the price breaks a resistance level and later retests it as support while the indicator exits oversold territory, traders may consider opening a long position.
Stop-Loss: Place below the previous local low.
Take Profit: Exit when a counter signal appears or according to your risk management strategy.
Sell Signal Example
A SELL signal may appear when:
- The main line exits the overbought zone.
- The broader trend is bearish, often confirmed by a moving average such as the 200-period moving average.
Traders may open a short position when the indicator drops from the overbought zone.
Stop-Loss: Place above the previous local high.
Take Profit: Close the trade when a counter signal appears or based on your preferred profit target.
Advantages of the Double Stochastic RSI Indicator
- Helps identify potential market entry points.
- Combines the strengths of two powerful oscillators.
- Works across multiple timeframes.
- Suitable for different markets including forex, crypto, and equities.
Limitations
- Does not include built-in alerts.
- May generate false signals during ranging markets.
To improve signal reliability, traders should combine it with Support And Resistance analysis, candlestick patterns, or volume indicators.
Conclusion
The Double Stochastic RSI Indicator for MT4 is a powerful momentum tool that merges the capabilities of the RSI and Stochastic oscillators. By highlighting overbought and oversold zones, it helps traders identify potential reversal opportunities and improve their trading decisions. When combined with other technical analysis methods, it becomes an effective addition to any trading strategy.
FAQ
1 Download
Published:
Mar 13, 2026 18:37 PM
Category: