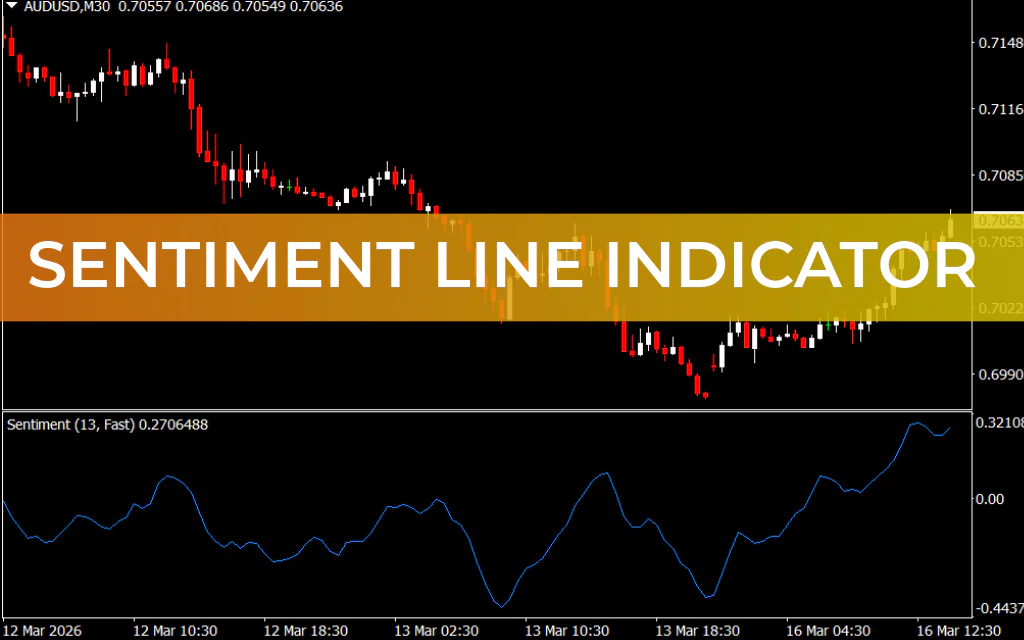
The Sentiment Line Indicator for MT4 is a technical analysis tool designed to measure market sentiment and price volatility. Instead of giving direct BUY or SELL signals, it helps traders understand how strong the bullish or bearish pressure is in the market and anticipate possible trend continuation or breakout moves.
By analyzing price gains and losses over a specific period, the indicator reflects the overall mood of traders and investors. This makes it a valuable tool for spotting pullbacks in trends and potential breakout directions in ranging markets.
Key Features
1. Market sentiment analysis
The indicator evaluates the balance between buyers and sellers to reveal the dominant market sentiment.
2. Trend Strength measurement
- Rising sentiment line → Strong bullish pressure
- Falling sentiment line → Strong bearish pressure
3. Works in all market conditions
- In trending markets → identifies pullbacks where traders can rejoin the trend.
- In sideways markets → hints at possible breakout directions.
4. Multi-timeframe compatibility
The Sentiment Line can be applied on any MT4 timeframe, making it suitable for Scalping, intraday trading, and swing trading.
5. Easy visual interpretation
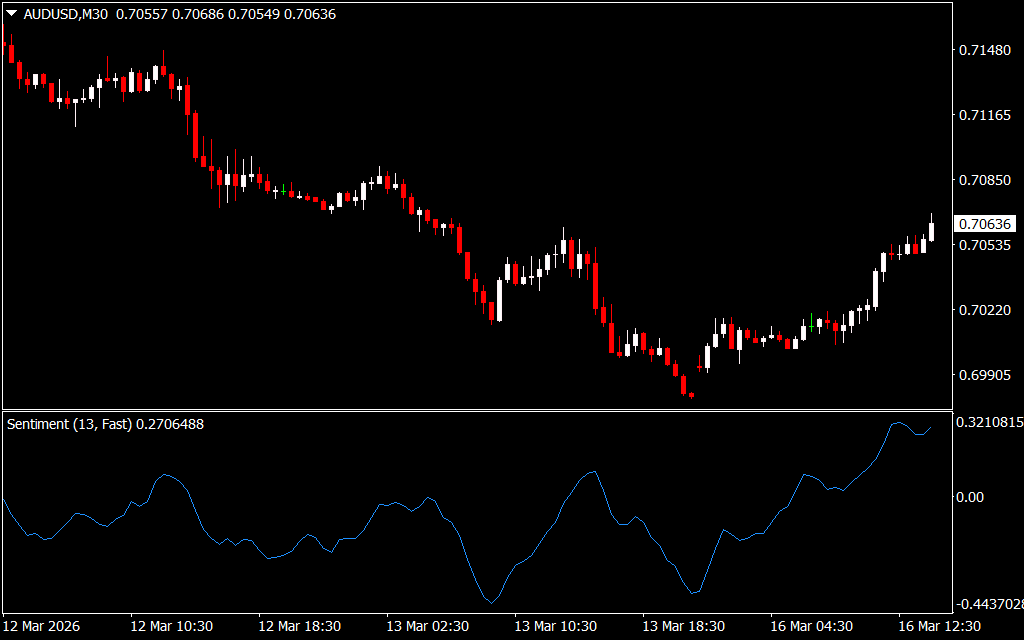
The smooth line movement makes it easier to see momentum shifts and trend strength.
How to Use the Sentiment Line for Trend Analysis
1. Bullish Market Condition
- The Sentiment Line moves upward, creating higher highs and higher lows.
- This indicates strong buying pressure.
- Pullbacks in price where the sentiment line holds above previous lows can signal trend continuation opportunities.
2. Bearish Market Condition
- The Sentiment Line moves downward, forming lower highs and lower lows.
- This indicates strong selling pressure.
- Traders may look for sell entries after retracements.
3. Identifying Trend Continuation
If the sentiment line bounces from a support trendline in the indicator window, it suggests the current trend is still strong.
Example scenario:
- Price consolidates.
- Sentiment line remains strong and rises again.
- Price eventually breaks the consolidation range and continues the trend.
This often signals momentum continuation.
Trading Tips
✔ Draw trendlines on the indicator itself to identify momentum shifts.
✔ Combine the Sentiment Line with Support And Resistance levels.
✔ Use it alongside trend indicators or Price Action strategies.
✔ Higher timeframes generally provide more reliable sentiment readings.
Pros and Cons
✅ Pros
- Helps identify true market sentiment behind price movement
- Useful in both trending and ranging markets
- Works across all timeframes
- Simple visual interpretation
❌ Cons
- Does not generate direct BUY/SELL signals
- Requires additional indicators or price action confirmation
- Beginners may need practice interpreting sentiment swings
Conclusion
The Sentiment Line Indicator for MT4 is a powerful tool for understanding the psychology behind price movement. By analyzing the balance between bullish and bearish pressure, it helps traders anticipate trend continuation, pullbacks, and potential breakout directions.
While it does not produce direct trade signals, combining it with support/resistance, price action, or trend indicators can significantly improve trading decisions. For beginners especially, it simplifies the complex task of analyzing market sentiment and trader behavior.
FAQ
Published:
Mar 16, 2026 09:52 AM
Category: