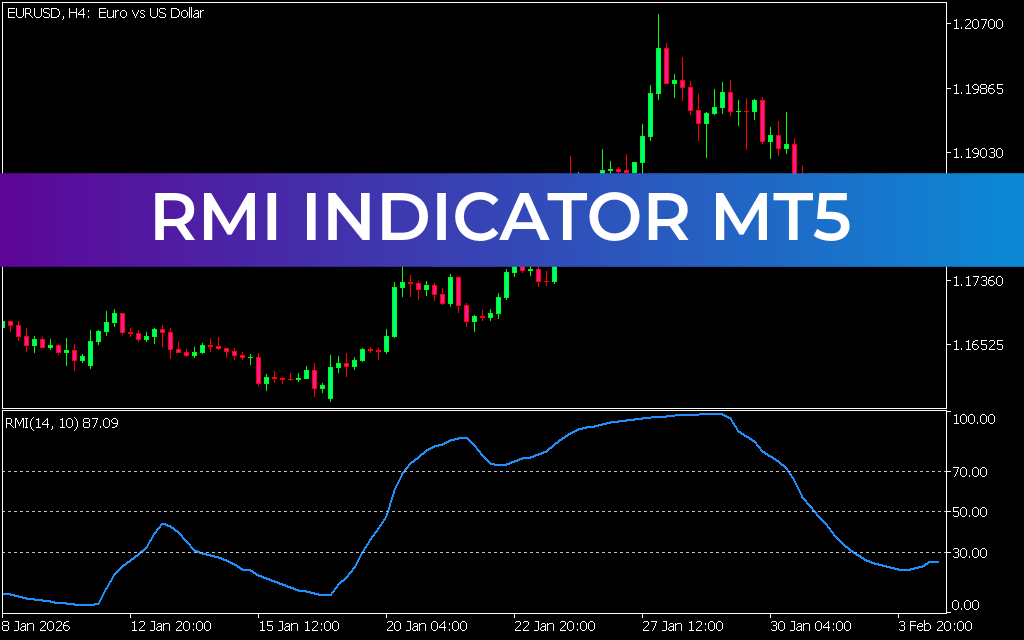
The RMI (Relative Momentum Index) Indicator for MT5 is an advanced technical oscillator that improves upon the traditional RSI (Relative Strength Index). It is designed to measure momentum more efficiently, making it a powerful tool for identifying overbought and oversold conditions, trend reversals, and divergence signals.
By combining RSI-style analysis with enhanced momentum sensitivity, the RMI provides traders with earlier and more refined trading signals.
What Is the RMI Indicator?
The RMI is a modified version of RSI that uses momentum over a selected period rather than simple price changes between adjacent bars. This makes it more responsive to market movements and better suited for active trading strategies.
Key characteristics include:
- Overbought level: 70
- Oversold level: 30
- More sensitive than traditional RSI
- Works across all timeframes and forex pairs
Key Features of RMI Indicator for MT5
- Improved version of RSI with momentum-based calculations
- Detects overbought and oversold conditions
- Identifies divergence signals for reversals
- Highlights chart patterns like:
- Double tops
- Double bottoms
- Head and shoulders
- Suitable for intraday, daily, weekly, and monthly charts
- Easy to use for beginners and advanced traders
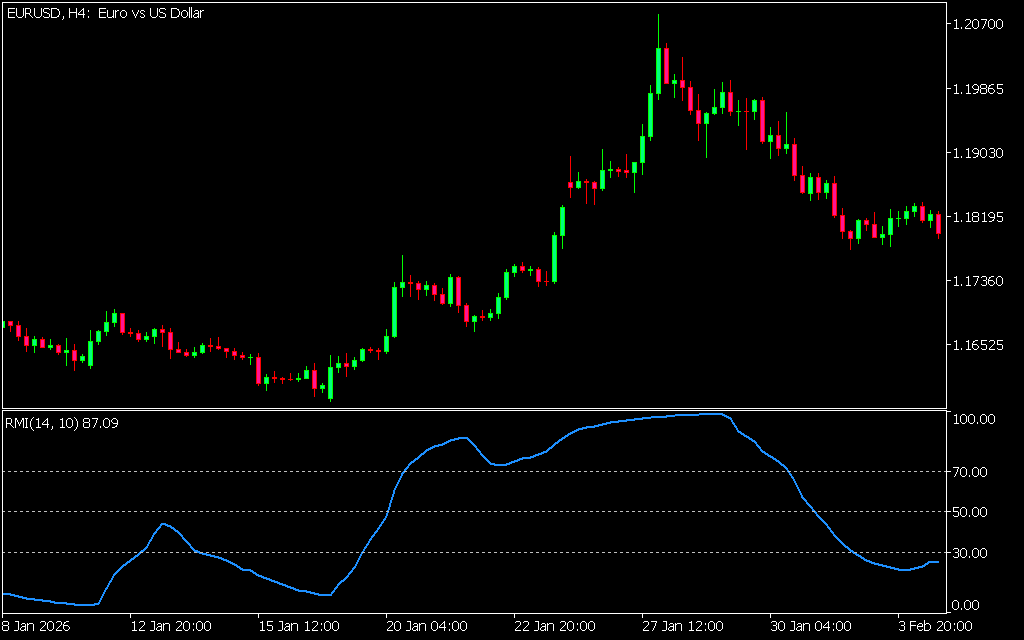
How the RMI Indicator Works
The indicator fluctuates between 0 and 100:
- Above 70 → Market is overbought
- Below 30 → Market is oversold
However, unlike RSI, RMI reacts more quickly to price momentum, helping traders capture earlier entry signals.
RMI Trading Strategies
1. Overbought & Oversold Strategy
Sell Setup
- RMI rises above 70
- Wait for it to cross back below 70
- Enter a SELL trade
- Stop loss: Above recent swing high
- Exit: At opposite signal or key support
Buy Setup
- RMI falls below 30
- Wait for it to cross back above 30
- Enter a BUY trade
- Stop loss: Below recent swing low
- Exit: At opposite signal or resistance
2. Chart Pattern Strategy
The RMI helps confirm classical reversal patterns such as:
- Double tops (bearish signal)
- Double bottoms (bullish signal)
- Head and shoulders formations
These patterns combined with RMI confirmation increase trade reliability.
3. Divergence Trading Strategy
Divergence occurs when price and the RMI move in opposite directions:
- Bullish divergence: Price makes lower lows while RMI forms higher lows → potential buy signal
- Bearish divergence: Price makes higher highs while RMI forms lower highs → potential sell signal
Divergence is considered a leading indicator and often signals strong reversals.
Best Timeframes for RMI
The RMI Indicator performs well on:
- Intraday charts (M15, H1, H4)
- Daily charts
- Weekly charts
- Monthly charts
Higher timeframes generally provide more reliable signals with fewer false positives.
Risk Management Tips
To improve trading performance:
- Always wait for confirmation after level crossovers
- Use stop-loss near swing highs or lows
- Avoid trading solely on overbought/oversold signals in strong trends
- Combine with Price Action or trend indicators
RMI vs RSI
Compared to RSI, the RMI:
- Reacts faster to price momentum
- Produces earlier signals
- Is more sensitive to market changes
- Provides additional pattern recognition and divergence clarity
This makes it a stronger alternative for active traders.
Conclusion
The RMI Indicator for MT5 is a powerful upgrade to the traditional RSI, offering faster momentum detection, clearer divergence signals, and enhanced pattern recognition. It is suitable for both beginners and experienced forex traders who want more responsive trading signals.
When combined with price action and proper risk management, the RMI can significantly improve trade timing and decision-making.
1 Download
Published:
Apr 13, 2026 08:24 AM
Category: