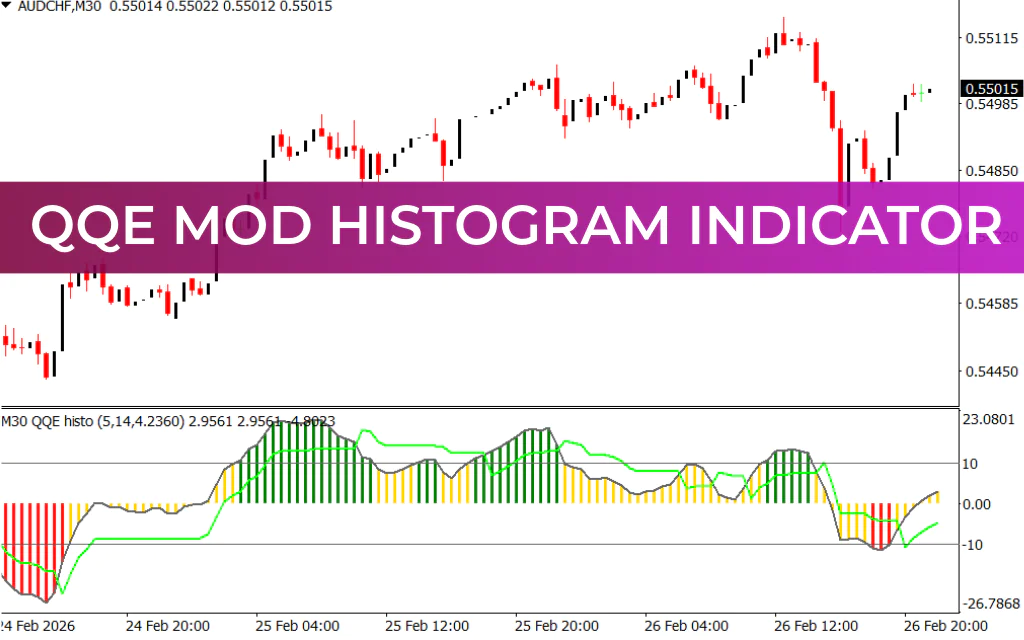
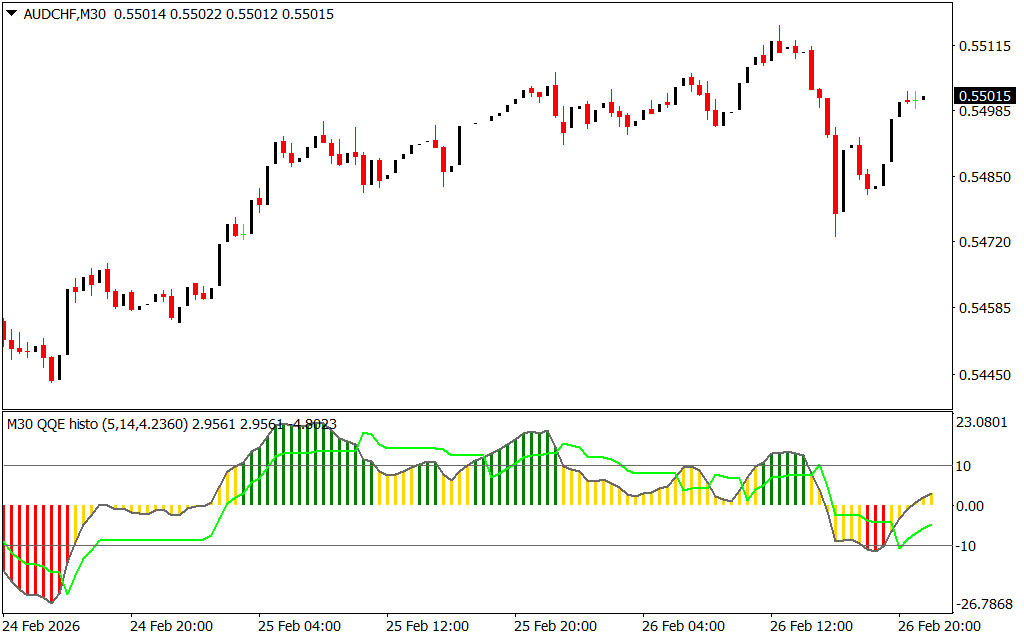
The QQE Mod Histogram indicator for MT4 is a modified version of the classic QQE (Quantitative Qualitative Estimation) indicator. By combining the RSI with a smoothing factor, it identifies overbought and oversold levels, market trend direction, and Trend Strength.
This indicator is ideal for both new and experienced traders and works on all timeframes—from intraday charts to daily, weekly, and monthly charts. It is also suitable for use in automated trading strategies.
How the QQE Mod Histogram Indicator Works
The indicator plots a color-coded histogram to reflect the current market condition:
- Green bars → Bullish trend
- Red bars → Bearish trend
- Yellow bars → Neutral trend
It also uses oscillator boundaries:
- Upper level: 60
- Lower level: 40
- Thresholds: +10 and -10
A histogram bar above +10 signals bullish momentum, while a bar below -10 indicates bearish momentum. Yellow bars signal indecision or a neutral market.
Trading Strategy Using QQE Mod Histogram
Buy Setup
- Histogram bar turns green
- Enter a buy trade
- Place a stop loss below the previous swing low
- Book profits if the histogram turns yellow or red
Sell Setup
- Histogram bar turns red
- Enter a sell trade
- Place a stop loss above the previous swing high
- Exit if the histogram turns yellow or green
Neutral Market
- Yellow bars indicate sideways or weak trend conditions.
- Traders may avoid taking positions until a clear bullish or bearish signal appears.
Key Features and Benefits
✔ RSI-based trend identification with smoothing factor
✔ Multi-color histogram for clear bullish, bearish, and neutral trends
✔ Trend strength measured via histogram height and color
✔ Works on all timeframes (M1 to Monthly)
✔ Suitable for Scalping, intraday, and long-term strategies
✔ Can be integrated into automated trading systems
✔ Free to download and easy to install
Why Use the QQE Mod Histogram Indicator?
The QQE Mod Histogram simplifies momentum and trend analysis by showing a visual representation of trend strength. Traders can identify overbought/oversold conditions, confirm trend direction, and filter trades more efficiently than with standard RSI or QQE alone.
It is especially useful for:
- Identifying momentum shifts in trending markets
- Confirming entry points for buy/sell trades
- Avoiding trades in neutral or choppy market conditions
Conclusion
The QQE Mod Histogram indicator for MT4 is a reliable RSI-based tool for analyzing market trend, momentum, and overbought/oversold levels. Its color-coded histogram makes trend direction and strength instantly clear, making it ideal for both manual and automated forex trading.
FAQ
1 Download
Published:
Feb 26, 2026 16:15 PM
Category: