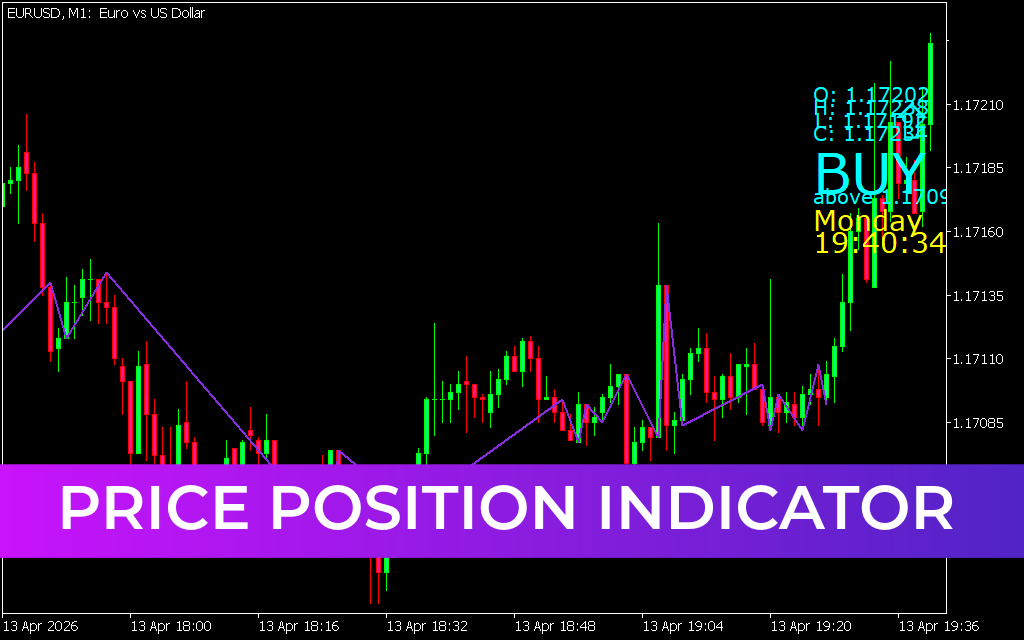
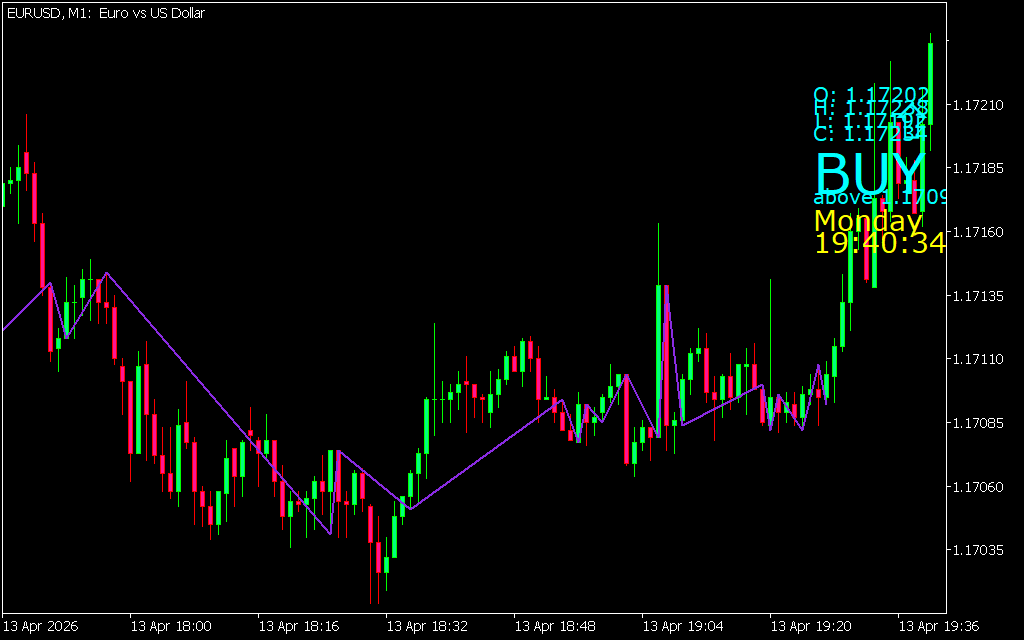
The Price Position Indicator for MetaTrader 5 (MT5) is a simple yet effective technical analysis tool designed to help traders identify market direction, Trend Strength, and potential buy/sell opportunities using visual angle-based signals.
By drawing directional angles directly on the chart, the indicator makes it easier to understand whether the market is moving upward, downward, or remaining neutral.
What Is the Price Position Indicator?
The Price Position Indicator analyzes price movement and represents market behavior through angled trend lines.
It helps traders:
- Identify overall market trend direction
- Spot BUY and SELL opportunities
- Understand short-term vs long-term price movement
- View real-time candle data (OHLC values)
In addition, it displays the open, high, low, and close of the current candle, giving traders more insight into Price Action.
How the Price Position Indicator Works
The indicator uses simple visual logic:
- 📈 Upward angle (blue line): Uptrend / bullish market
- 📉 Downward angle: Downtrend / bearish market
- ➖ Flat or neutral angle (yellow): Sideways or low volatility market
It continuously updates based on price movement and reflects Market Structure in real time.
BUY and SELL Signals
The indicator also provides basic trading signals based on trend shifts.
BUY Signal
A BUY opportunity appears when:
- The indicator shifts into an upward angle
- Market structure changes from bearish to bullish
- Momentum begins moving higher
SELL Signal
A SELL opportunity appears when:
- The indicator shifts into a downward angle
- Market structure changes from bullish to bearish
- Downward momentum strengthens
Market Behavior Explained
The Price Position Indicator differentiates between:
🔹 Impulse Waves
- Strong directional movements
- Represent short-term price acceleration
🔹 Corrective Waves
- Temporary pullbacks or retracements
- Represent consolidation within a trend
This helps traders understand whether they are seeing a continuation or correction phase.
Neutral Market Conditions
When the market shows low activity or consolidation:
- The indicator displays a yellow angle
- No strong BUY or SELL bias is present
- This signals a range-bound or indecisive market
Best Timeframes to Use
The Price Position Indicator can be used on:
- ⏱ M15–M30 for Scalping
- 📊 H1–H4 for intraday trading
- 📈 Daily charts for swing trading
It performs consistently across all timeframes, but higher timeframes generally provide more reliable signals.
Trading Strategy Tips
To improve accuracy:
- Combine with RSI or Moving Averages
- Avoid trading during neutral (yellow) phases
- Wait for clear angle confirmation before entering trades
- Use price action for additional validation
Advantages of Price Position Indicator
- Simple visual trend identification
- Shows real-time market direction
- Includes OHLC candle data
- Works across all forex pairs and timeframes
- Easy for beginners to understand
Limitations
- Can produce false signals in choppy markets
- Not reliable as a standalone system
- Requires confirmation from other indicators
- May lag during rapid market reversals
Final Thoughts
The Price Position Indicator for MT5 is a straightforward trend visualization tool that helps traders quickly understand market direction using angled signals. Its ability to display both trend strength and candle data makes it useful for beginners and intermediate traders.
However, like most indicators, it performs best when combined with other technical tools such as RSI, moving averages, or price action analysis to confirm trade setups.
5 Downloads
Published:
Apr 13, 2026 12:42 PM
Category: