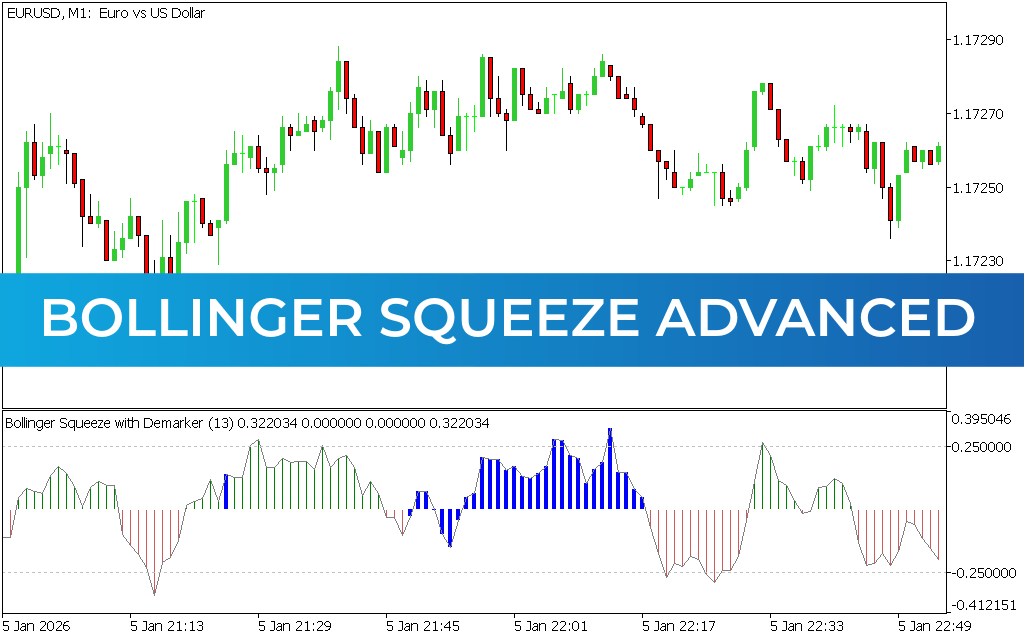
The Bollinger Squeeze Advanced Indicator for MT5 is a volatility-based technical analysis tool built on the concept of Bollinger Bands, but redesigned as an oscillator. Instead of displaying bands on the price chart, it appears in a separate window and fluctuates around a zero line, making it easier to interpret momentum shifts and breakout conditions.
This indicator is especially useful for identifying market compression (squeeze conditions) followed by potential breakout moves.
What Is the Bollinger Squeeze Advanced Indicator?
The Bollinger Squeeze Advanced Indicator measures market volatility and momentum by analyzing how price behaves relative to Bollinger Band compression phases.
It helps traders detect:
- Low volatility consolidation (squeeze phase)
- Breakout direction bias
- Trend continuation strength
- Potential market reversals
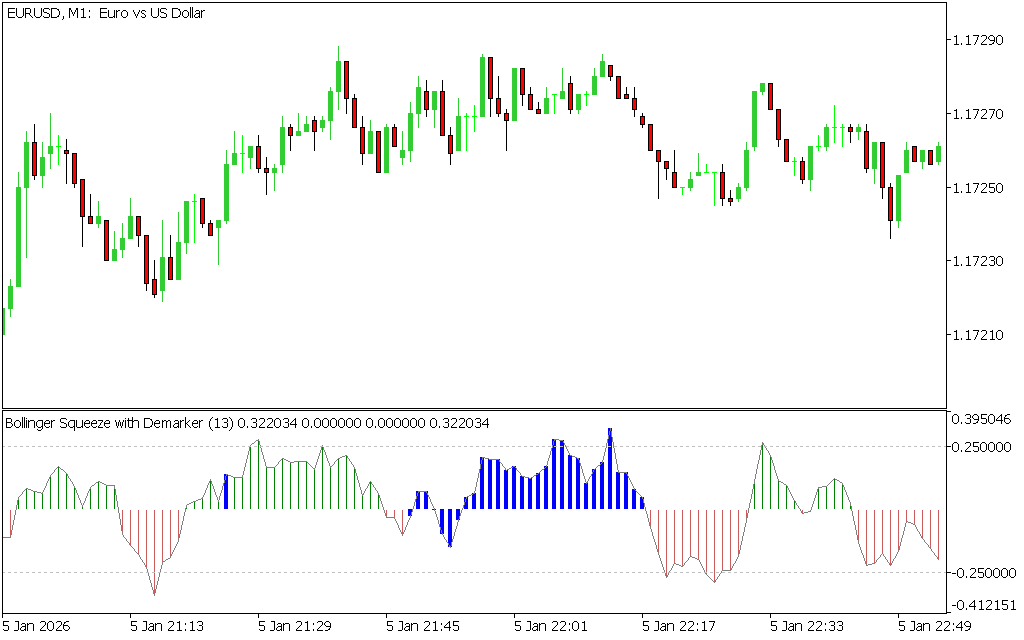
The indicator uses a histogram with color-coded signals to represent market sentiment.
Key Features of Bollinger Squeeze Advanced Indicator for MT5
- Based on Bollinger Band volatility compression
- Works as an oscillator in a separate window
- Color-coded histogram (red, blue, green)
- Identifies breakout and trend phases
- Measures market volatility and momentum shifts
- Suitable for Scalping, intraday, and swing trading
How the Bollinger Squeeze Advanced Indicator Works
The indicator fluctuates around a zero line, where:
- Green bars above zero → bullish momentum / uptrend bias
- Red bars below zero → bearish momentum / downtrend bias
- Blue bars near zero → squeeze or breakout preparation phase
This structure helps traders anticipate when price is likely to leave consolidation.
BUY and SELL Signals
Buy Signal
A BUY setup occurs when:
- Histogram turns green and crosses above zero level
- Market shows bullish breakout from consolidation
- Price confirms upward momentum
Entry: Enter buy trade after bullish confirmation
Stop Loss: Below recent swing low or support zone
Exit: When histogram weakens or turns red
Sell Signal
A SELL setup occurs when:
- Histogram turns red and crosses below zero level
- Bearish momentum increases after a squeeze
- Price confirms downward breakout
Entry: Enter sell trade after confirmation
Stop Loss: Above recent swing high or resistance
Exit: When histogram turns green or momentum fades
How to Use the Bollinger Squeeze Indicator Effectively
For best results:
- Trade in the direction of the main trend
- Avoid sideways chop without breakout confirmation
- Use Price Action signals for entry timing
- Combine with support and resistance levels
- Wait for clear zero-line confirmation
Best Timeframes
The indicator performs best on:
- H1 for intraday trading
- H4 for swing trading
- Daily charts for long-term trend setups
Higher timeframes generally provide stronger and more reliable breakouts.
Recommended Indicator Combinations
To improve accuracy, combine with:
- Moving Averages (trend direction)
- RSI (momentum confirmation)
- MACD (Trend Strength validation)
- Support & Resistance zones
Advantages of Bollinger Squeeze Advanced Indicator
- Detects volatility compression and breakout phases
- Clear visual momentum signals
- Helps identify early trend formation
- Works well in trending markets
- Easy to use for beginners and advanced traders
Limitations
- Can produce false signals in ranging markets
- Requires confirmation before entry
- Less effective without trend filtering
- Best used with additional indicators
Conclusion
The Bollinger Squeeze Advanced Indicator for MT5 is a powerful volatility and momentum tool that helps traders identify breakout opportunities after periods of consolidation. By analyzing squeeze conditions and color-coded momentum shifts, it provides clear guidance on potential market direction.
When combined with price action and trend analysis, it becomes a highly effective tool for improving trading accuracy and timing.
Published:
Apr 13, 2026 08:57 AM
Category: