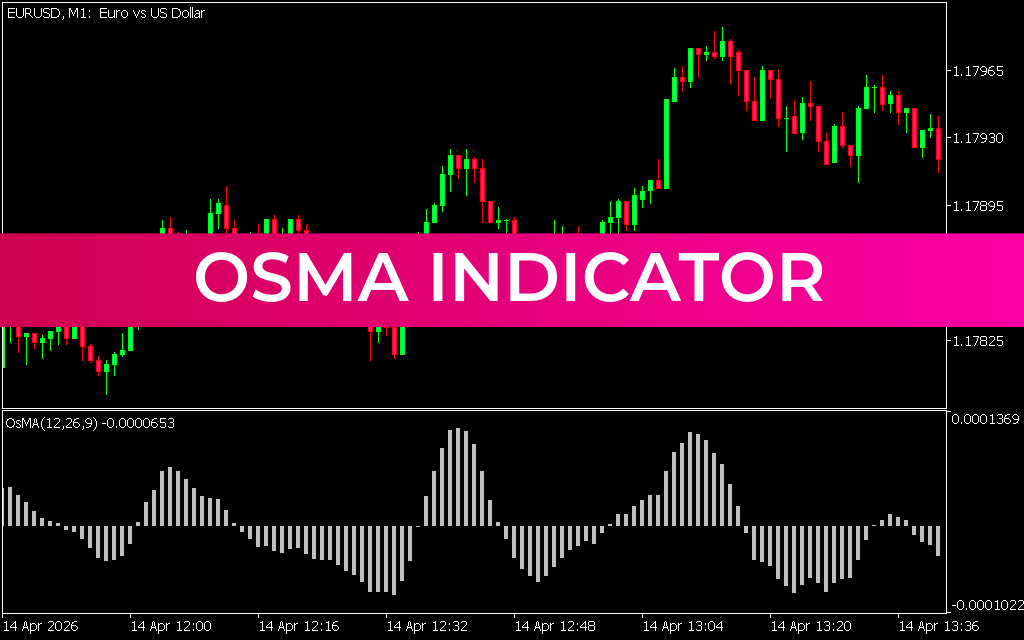
The OSMA (Moving Average of Oscillator) Indicator for MetaTrader 5 is a momentum-based technical tool used to identify Trend Strength, overbought/oversold conditions, and potential market reversals. It is derived from the MACD indicator and presents the difference between the MACD line and its signal line as a histogram.
Because of its simplicity and effectiveness, OSMA is widely used by traders who focus on divergence and reversal trading strategies.
What Is the OSMA Indicator?
OSMA stands for Moving Average of Oscillator. It measures the difference between:
- MACD line (fast EMA − slow EMA)
- Signal line (moving average of MACD)
Formula:
OSMA = MACD − Signal Line
This calculation produces a histogram that visually represents momentum shifts in the market.
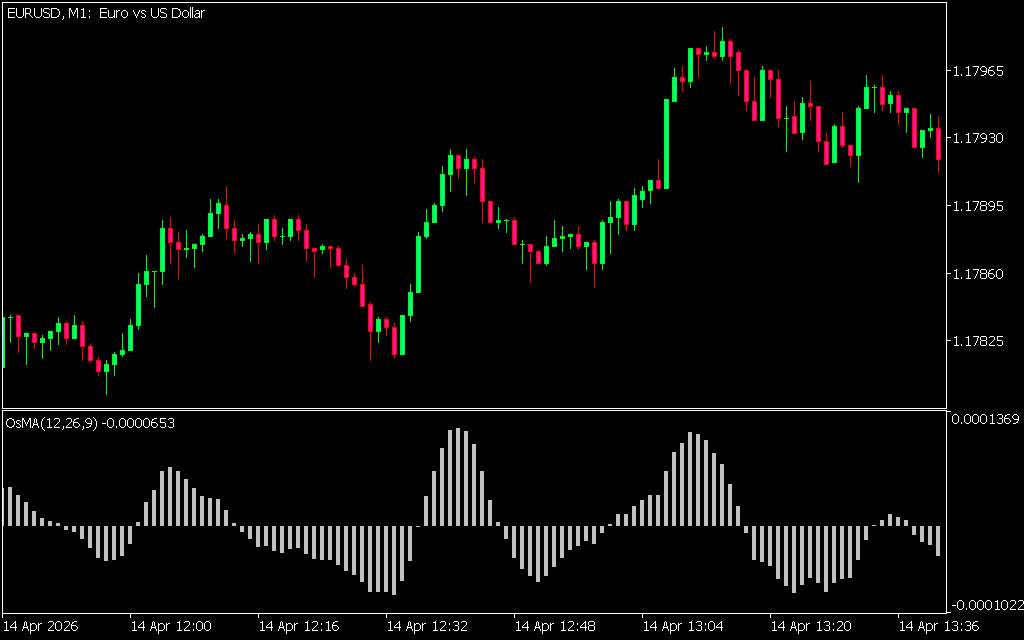
How the OSMA Indicator Works
The OSMA indicator displays a histogram below the price chart:
- Positive histogram values → Bullish momentum
- Negative histogram values → Bearish momentum
- Decreasing bars → Weakening trend
- Increasing bars → Strengthening trend
When the histogram approaches the zero line, it often signals a potential trend change.
Key Features of OSMA
- Based on MACD momentum structure
- Displays histogram for easy interpretation
- Helps identify divergence patterns
- Works across all timeframes
- Useful for Trend Reversal strategies
How to Trade with OSMA Indicator
BUY Strategy (Bullish Reversal):
- Identify price making lower lows or consolidation
- Check if OSMA shows bullish divergence (indicator rising while price falls)
- Wait for histogram to approach or cross zero line
- Enter BUY trade after confirmation
- Place Stop Loss below recent swing low
- Exit when momentum weakens or reverses
SELL Strategy (Bearish Reversal):
- Identify price making higher highs
- Confirm bearish divergence (price up, OSMA falling)
- Wait for histogram to weaken toward zero line
- Enter SELL trade after confirmation
- Place Stop Loss above recent swing high
- Exit when histogram begins to recover
Understanding Divergence (Key OSMA Strategy)
Divergence is the most powerful OSMA trading signal:
Bullish Divergence:
- Price forms lower lows
- OSMA forms higher lows
- Indicates potential upward reversal
Bearish Divergence:
- Price forms higher highs
- OSMA forms lower highs
- Indicates potential downward reversal
Best Market Conditions for OSMA
OSMA performs best in:
- Trending markets with pullbacks
- Reversal zones
- High volatility conditions
It is less effective in extremely flat markets without clear momentum shifts.
Why Traders Use OSMA
- Simple histogram visualization
- Strong divergence detection tool
- Derived from trusted MACD structure
- Works on all assets and timeframes
- Helps identify early reversal signals
Trading Tips for Better Results
To improve OSMA accuracy:
- Combine with support and resistance levels
- Use Price Action confirmation (candlesticks)
- Avoid trading in low-volatility sideways markets
- Use higher timeframe trend direction for confirmation
Final Thoughts
The OSMA Indicator for MT5 is a powerful momentum and divergence tool derived from MACD. By analyzing the relationship between MACD and its signal line, it provides clear insight into market strength and potential reversal points.
When combined with price action and proper risk management, OSMA becomes a highly effective tool for identifying trend reversals in Forex trading.
3 Downloads
Published:
Apr 14, 2026 09:24 AM
Category: