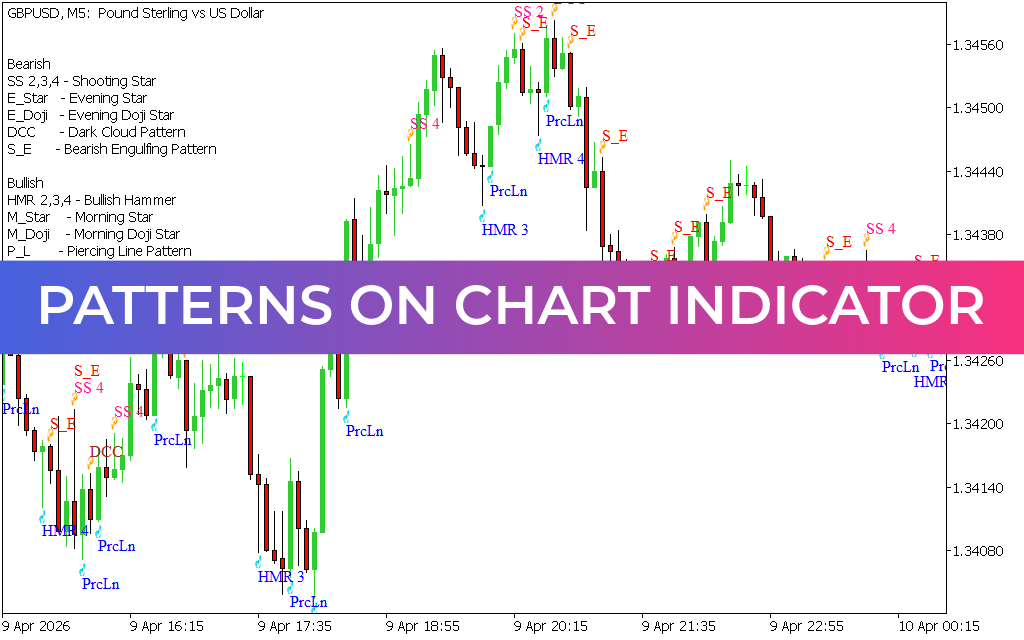
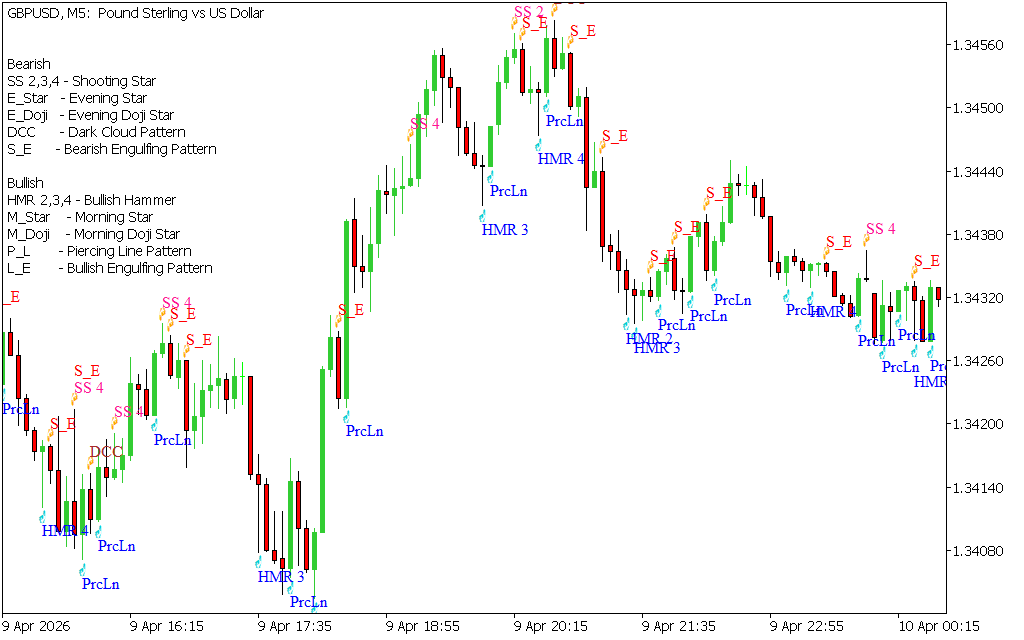
The Patterns On Chart Indicator for MT5 is an automatic candlestick pattern recognition tool designed to help traders identify chart formations quickly and accurately. It scans Price Action in real time and highlights potential candlestick patterns directly on the chart.
This makes it especially useful for beginners who want to understand price action trading without memorizing complex candlestick formations.
What is the Patterns On Chart Indicator?
The Patterns On Chart Indicator is a technical analysis tool that automatically detects candlestick patterns on MT5 charts.
It helps traders identify:
- Market sentiment
- Reversal signals
- Continuation patterns
- Price structure behavior
Instead of manually analyzing candles, the indicator does the work automatically after each candle closes.
How Does the Indicator Work?
The indicator scans historical price data (up to 200 bars) and detects recognizable candlestick formations such as:
- Bullish engulfing
- Bearish engulfing
- Pin bars
- Reversal patterns
It then displays these patterns directly on the chart for easy interpretation.
Key Features of Patterns On Chart Indicator
- Automatic candlestick pattern detection
- Works on all timeframes
- Analyzes up to 200 candles history
- Helps identify market sentiment
- Suitable for beginners and advanced traders
- Works with forex, stocks, and indices
How to Use Patterns On Chart Indicator in MT5
Candlestick patterns provide insights into market psychology and potential price direction.
However, this indicator works best when combined with trend analysis tools.
Trading Strategy Example
In the USD/JPY daily chart example:
- A 10-period moving average (SMA) is used to identify trend direction
- Price above SMA → bullish trend
- Price below SMA → bearish trend
BUY Strategy
A BUY setup occurs when:
- Bullish candlestick patterns appear above the moving average
- Price is trending upward
- Market shows strong bullish momentum
This indicates continuation of an uptrend or reversal upward.
SELL Strategy
A SELL setup occurs when:
- Bearish candlestick patterns appear near resistance
- Price is below moving average
- Momentum weakens
This indicates a potential downtrend or reversal.
Trend Filtering Strategy
To improve accuracy:
- Use a moving average (e.g., 10 SMA or 50 SMA)
- Trade only in the direction of the trend
- Ignore weak or low-quality patterns in sideways markets
This reduces false signals and improves win rate.
Key Benefits of Patterns On Chart Indicator
- Automatically detects candlestick patterns
- Saves time in manual chart analysis
- Helps beginners learn price action trading
- Improves trade decision accuracy
- Works across all markets and timeframes
Limitations
- May detect multiple signals in volatile markets
- Requires confirmation from trend indicators
- Should not be used alone for trading decisions
Conclusion
The Patterns On Chart Indicator for MT5 is a powerful tool for automatically identifying candlestick patterns and improving price action analysis. It helps traders understand market sentiment and spot potential trade setups more efficiently.
When combined with trend indicators like moving averages, it becomes a highly effective trading assistant for both beginners and experienced traders.
Best of all, the Patterns On Chart Indicator is completely free to download, making it a valuable addition to any trading strategy.
4 Downloads
Published:
Apr 11, 2026 05:45 AM
Category: