The DeMark Trend Lines Indicator for MT5 is a technical analysis tool designed to automatically plot trend-based support and resistance levels on the chart. It helps traders identify market direction, breakout zones, and potential reversal areas using a combination of diagonal and horizontal trendlines.
By analyzing recent highs and lows, the indicator visually maps price structure and simplifies trend identification for Forex traders.
What Is the DeMark Trend Lines Indicator?
The DeMark Trend Lines indicator is based on DeMark trendline theory, which focuses on identifying market turning points using the last two highs and lows.
It plots:
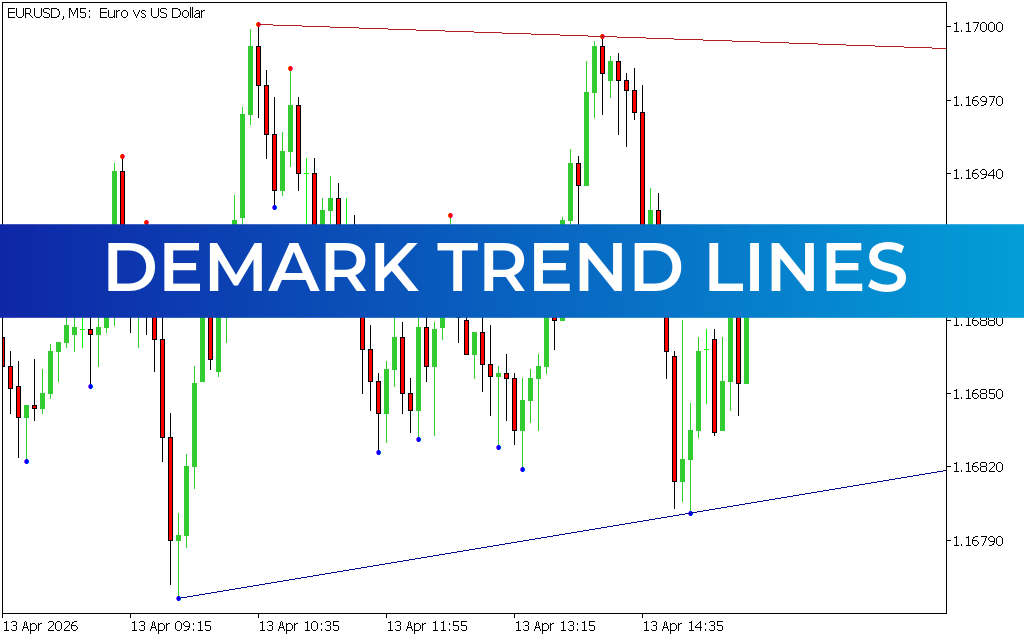
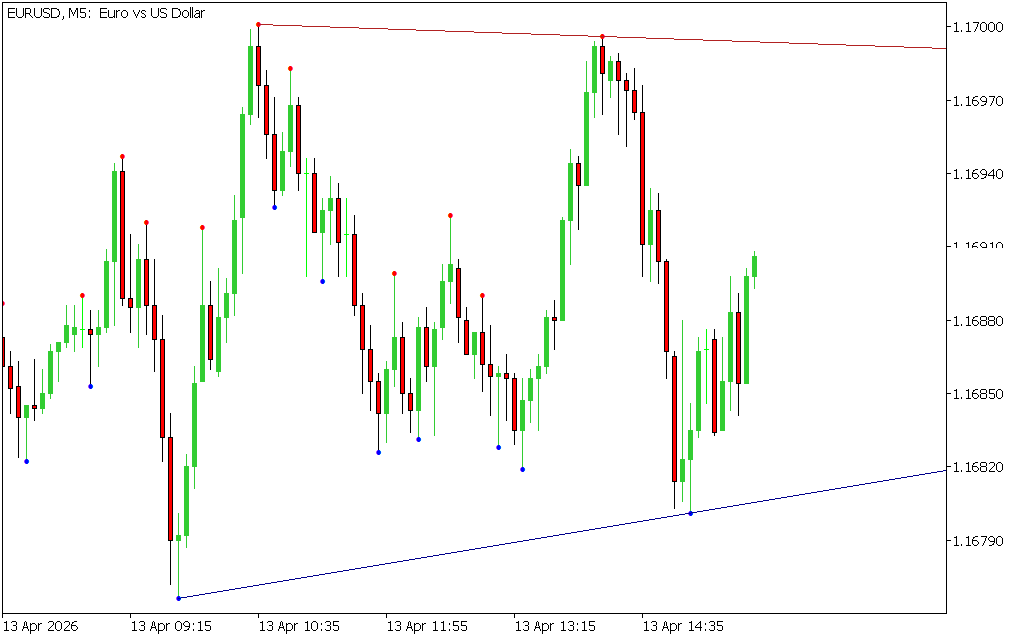
- Diagonal trendlines (trend direction)
- Horizontal support and resistance levels
- Colored candle border dots for visual confirmation
This combination helps traders understand both current trend direction and key price zones.
Key Features of DeMark Trend Lines Indicator for MT5
- Automatically draws trendlines using recent price structure
- Identifies dynamic support and resistance zones
- Displays diagonal and horizontal trend levels
- Uses colored lines and dots for clarity
- Works best on higher timeframes
- Helps detect breakouts and reversals
How the DeMark Trend Lines Indicator Works
The indicator calculates trend levels based on the last two swing highs and lows, then plots:
Diagonal Lines
- HL1 (Red line): resistance-based trendline
- LL1 (Green line): support-based trendline
Horizontal Lines
- HC1 (Red line): resistance zone
- LC1 (Blue line): support zone
These levels adjust automatically as new price data forms.
BUY and SELL Signals
Buy Signal
A BUY setup occurs when:
- Price approaches or bounces from the blue support line (LC1)
- Diagonal support (green line) holds
- Bullish Price Action confirms upward movement
Entry: Buy after bullish confirmation
Stop Loss: Below support or recent swing low
Exit: Near resistance (red lines or HC1 level)
Sell Signal
A SELL setup occurs when:
- Price touches or rejects the red resistance line (HC1)
- Diagonal resistance (red line) holds
- Bearish reversal signals appear
Entry: Sell after confirmation
Stop Loss: Above resistance or recent swing high
Exit: Near support (blue lines or LC1 level)
How to Use DeMark Trend Lines Effectively
To improve accuracy:
- Wait for price confirmation at trendlines
- Combine with RSI or MACD for momentum validation
- Use breakout confirmation before entering trades
- Avoid trading during low-liquidity sideways markets
Best Timeframes
The indicator performs best on:
- H1 (intraday trading)
- H4 (swing trading)
- Daily charts (trend analysis)
Lower timeframes may produce false or unstable signals.
Recommended Indicator Combinations
For stronger trading results, combine with:
- RSI (overbought/oversold confirmation)
- MACD (trend momentum confirmation)
- Moving Averages (trend direction filter)
- Candlestick patterns (entry timing)
Limitations
- Can produce false signals on lower timeframes
- Requires confirmation for best accuracy
- Works best in trending or structured markets
- Not ideal as a standalone system
Conclusion
The DeMark Trend Lines Indicator for MT5 is a powerful trend visualization tool that automatically draws dynamic support and resistance levels using price structure analysis. It helps traders identify trend direction, key reversal zones, and breakout opportunities with clarity.
When combined with momentum indicators and
12 Downloads
Published:
Apr 13, 2026 08:46 AM
Category: